Analyze the data › Analysis Workspace
Curation and Templates
A marketing manager asks for a report on campaign performance. Somebody builds it properly, over an afternoon, with panels for each channel, a fallout for the signup journey, a cohort table showing whether the people acquired in each campaign came back, and a set of carefully chosen segments applied where they belong. It is genuinely good work and it answers the question that was asked.
Two weeks later the same manager is back, slightly embarrassed, asking whether somebody could just pull the numbers again. They opened the project, saw a left rail with three hundred components in it, dragged something that looked right into a table, got a number that disagreed with the one in the meeting, and decided it was safer to ask.
Nothing broke. The project is exactly as it was. What happened is the ordinary fate of analysis handed to somebody who does not share the mental model that produced it, and it happens to almost every project that gets built for another person. The tables are correct, the segments are right, and none of that survives contact with a reader who does not know which of three similarly named metrics is the one the business agreed on.
Curation is Adobe's answer to that, and it is a smaller feature than the problem, so this section covers the feature and then the two habits around it that do most of the actual work.
What curation actually removes
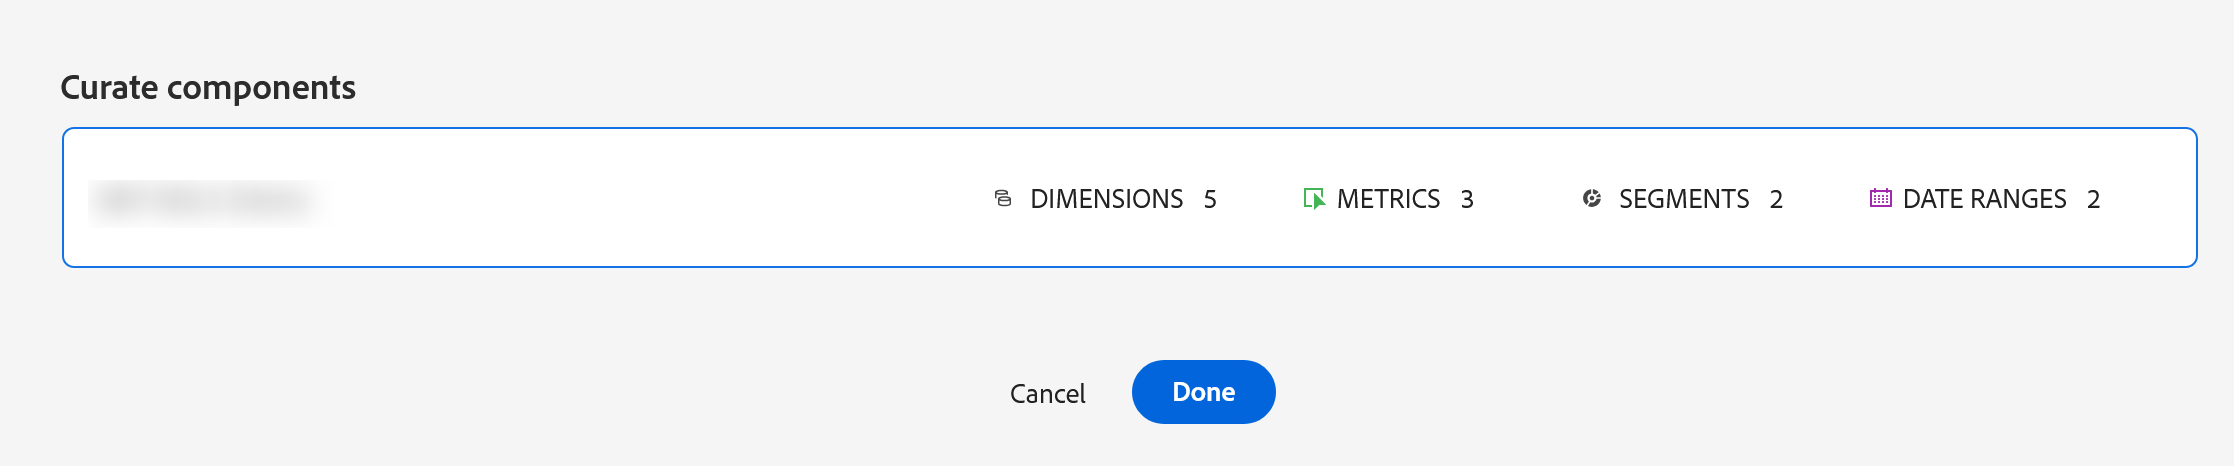
Curating a project means choosing which components a recipient can see in the left rail when they open it. You pick a handful of dimensions, metrics, segments and date ranges, and everything else disappears from their view.
It is worth being precise about what that does and does not do, because the name suggests something grander. Curation does not change the data, it does not restrict what the person is permitted to access elsewhere in Adobe Analytics, and it does not lock the tables. Somebody with edit rights can still rebuild whatever they like. What it changes is the size of the room: instead of three hundred components with four similar-sounding conversion metrics among them, the rail holds the eight that belong to this question, one of which is the conversion metric the business actually agreed on.
Which sounds modest until you think about what a person does when they are handed too many options and no guidance. They pick the one whose name most resembles what they were asked for, which in a mature report suite is roughly a coin toss, and then they quote it. Curation is not really about tidiness. It is about removing the opportunity to be confidently wrong.
Annotations, and the note that answers a question before it is asked
The second habit is smaller than curation and, over a couple of years, probably matters more.
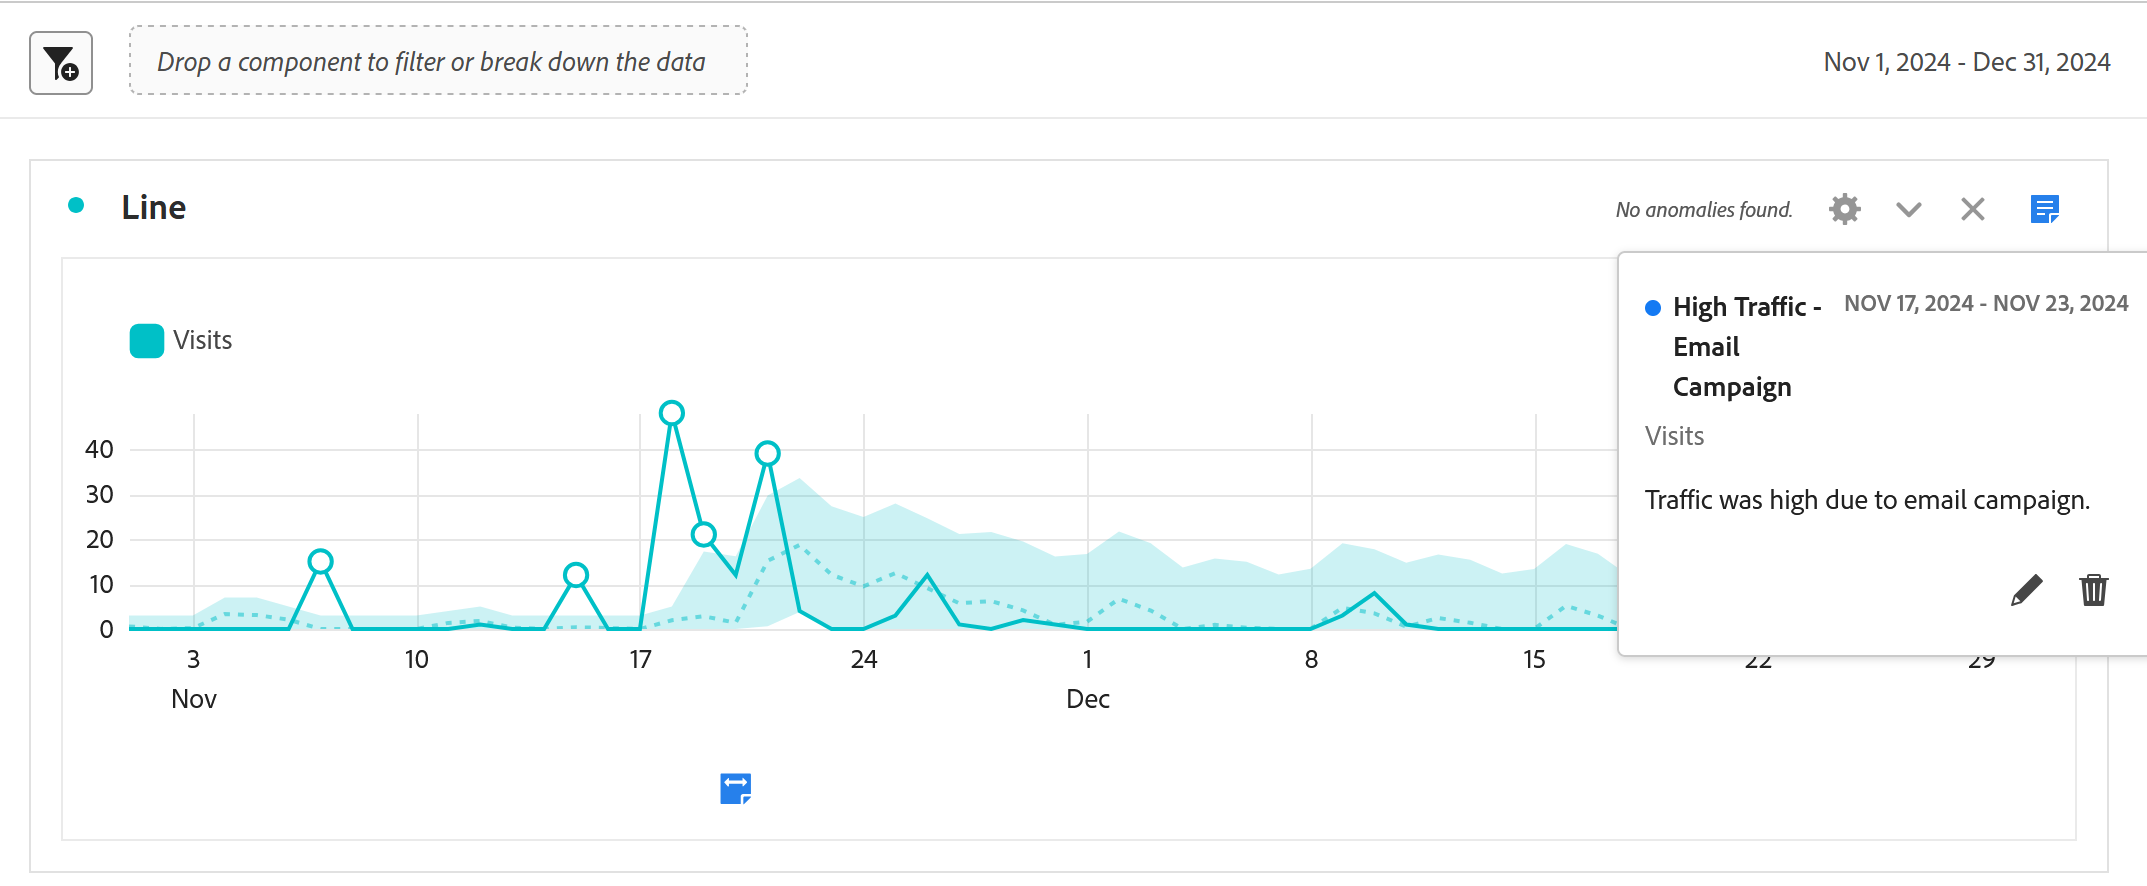
An annotation is a dated note attached to a date range, a metric, or a whole project, and it shows up on the chart at the point in time it refers to. Traffic dropped on the eleventh because a CDN change broke tagging for four hours. Revenue jumped in the third week because a partner promotion ran. The variable stopped being populated in March because it was repurposed for something else.
Every one of those facts is known by exactly one person on the day it happens, and completely lost within about six weeks. What follows is a familiar and expensive ritual: somebody notices the dip a quarter later, asks what happened, three people guess, one of them goes and rebuilds an investigation that was already done at the time, and eventually somebody who was there remembers. That whole sequence is prevented by a sentence typed on the day, and the sentence takes thirty seconds.
This matters beyond charts, because several things elsewhere in Adobe Analytics quietly depend on somebody having written a date down somewhere findable. An eVar that was repurposed has a seam in its history where old and new meanings meet, and anybody reading across that seam gets nonsense. Report suite settings change, and the day they changed is the day trends stop being comparable. A calculated metric whose formula was corrected re-answers all of history under the new rule, so the number in last quarter's deck no longer reproduces. In every one of those cases the advice is the same, which is to record the date where a future analyst will find it, and an annotation is the only place in this product that qualifies.
The reason this habit fails is never that people disagree with it. It fails because the value arrives months later and the cost arrives now, on a day when something is already going wrong and writing notes feels like the least urgent thing available. The way through is to make it part of the incident rather than a follow-up: whoever works out why a number moved writes the annotation before closing the tab, in one plain sentence, while they still have the answer in their head. A team that does this for a year ends up with a chart that explains itself, and the first time somebody avoids a two-day investigation by reading a note, the habit stops needing to be argued for.
Templates, and the difference between reuse and copying
The third habit is about what happens when the same project gets built for the fourth time.
Adobe ships a set of templates for common questions, and a company can save its own projects as templates for everyone else to start from. Both are useful, and the second is the one that changes how an organization works, because it moves the standard version of a recurring analysis out of one person's folder and into something the team starts from by default.
The alternative, which is what most teams do, is copying. Somebody finds a project that looks close, saves a copy, changes the dates and a segment, and ships it. That works, and it works right up until the definition underneath changes, at which point there are eleven copies in circulation and the correction reaches one of them. Six months later two people present different numbers for the same thing and both of them are reading a report that was correct when it was made.
A template does not entirely solve that, since a project created from a template is still a copy from that moment on. What it does is make the starting point deliberate and singular, so that new work begins from the agreed shape rather than from whichever old project happened to be nearby, and so that the agreed shape has an owner who can update it.
| Habit | What it prevents | Cost to you |
|---|---|---|
| Curation | A reader quoting the wrong one of four similar metrics | Two minutes, once, before sharing |
| Annotation | An investigation being run twice, months apart | Thirty seconds, on the day |
| Template | Eleven diverging copies of one recurring report | One save, plus somebody owning it |
| A text block saying what was found | The project being opened once and never reopened | One sentence per panel |
Follow along: hand a project over properly
The exercise here is not building anything new. It is taking a project you already have and doing the four things that decide whether somebody else can use it.
- Start with a project you built for somebody else
- Open it and read it as if you had never seen it. Can you tell what question each panel answers? If not, nobody else can either.
- Write the findings
-
Drag
Visualizations›Textabove each panel, and write one sentence per panel saying what it found. Not what it shows. What it found. - Curate
- Choose
Share›Curate project data. - Select only the components this project needs. Include the one conversion metric the business agreed on, and leave the three that sound like it out.
- Reopen it as a recipient would see it, and count the rail.
- Annotate
- Find a date in the data where something visibly moved.
- Create an annotation on that date with one plain sentence. If you do not know what happened, that is the finding: nobody wrote it down, and now nobody can.
- Template, if it recurs
- If this project will be rebuilt monthly, save it as a company template rather than letting people copy it. Then decide who owns it, because a template without an owner becomes eleven copies within a year anyway.
There is nothing else to configure. Curation is a selection, annotations are sentences, and templates are a save. The work is entirely in deciding what a stranger needs.
Everything above is the least you should do rather than the most. Step 1 is the one people skip and the one that produces the finding, because reading your own project cold is uncomfortable in a way that is immediately instructive.
The dull part decides whether it gets used
Curation reduces the component rail a recipient sees to the handful that belong to the question, which does not restrict their access anywhere else and does remove most of the opportunity for a confident mistake. Annotations attach a dated sentence to the chart where the event happened, which is the only place in this product that a future analyst will reliably find it. Templates move the standard version of a recurring analysis out of one person's folder and give it an owner.
None of the three is technically interesting, and that is rather the point. The hard part of analysis was over several sections ago, and everything that decides whether the work is used by anybody else is this kind of small, dull, unglamorous discipline applied on the day rather than later.
What remains is the act of handing it over, which turns out to have more shape to it than it appears. There are several ways to share a project, they grant genuinely different powers, and picking the wrong one either strands the recipient or gives them the ability to change a report that other people depend on. Sharing and Collaboration covers the choices and what each one really means.
Curation sits under Share > Curate project data inside an open project. It applies to anybody the project is shared with, and it can be changed at any time.
Annotations are created from the Components > Annotations manager, or directly by right-clicking a point on a time-based visualization. Templates are saved through Project > Save as template, and Adobe's own templates appear on the Workspace landing page when you create a new project.
This article focuses on the concepts, architecture, and practical guidance behind the topic. For the latest UI walkthroughs and step-by-step implementation instructions, use the links below. They leave this site and open Adobe's own documentation in a new tab.