Analyze the data › Attribution Models
Choosing an Attribution Model
A company has two dashboards. The marketing team built one on first touch with a 90 day window, because their job is acquisition. The ecommerce team built the other on the default, because nobody told them there was a default to change.
Both are called Orders by Channel. Both go out weekly. Both are correct. They disagree about paid search by a factor of three.
A new commercial director asks which one is right. The honest answer is that both are, and that is the worst thing anybody can say in that meeting. It sounds like dodging the question, and it suggests the analytics team cannot count.
Nobody picked the wrong model here. The company never asked anyone to pick one, so two teams each made their own choice and neither was wrong to.
Pick one model for reporting, use the rest to investigate
The most useful thing to understand about this choice is that consistency matters more than correctness.
A business that has reported on last touch for three years, badly matched to its long buying cycle, still knows whether this quarter beat the last one and still sees when a channel breaks. A business that reports on whatever model the analyst preferred that week knows nothing. Any change in any number could be a change in performance or a change in the rule, and there is no way to tell them apart afterwards.
So this is a governance decision before it is an analysis one. Choose one model and one window. Write them down. Apply them to everything that trends over time or feeds a target. Change them only on purpose, with an annotation marking the date. Every other model stays available and gets used all the time, but for investigating rather than reporting, and anything you produce that way carries the name of the model that produced it.
For the house model itself, here is where to start.
If most sales happen in one or two touches, keep last touch. The None row and a first-against-last comparison will already have told you this. Last touch reconciles, everyone understands it, and a cleverer model would be sharing out credit that is not there to share.
If journeys are long and cross several channels, move to U-shaped at a measured window with Visitor scope. It credits the two moments you can act on, finding and closing, without claiming to know what the middle did.
Use linear only where the touches really are equal, which is rarer than it sounds and mostly describes repeated engagement rather than marketing. And keep algorithmic out of the house position. Not because it is worse, but because a number nobody can explain in a meeting will not survive its first challenge.
Adopt one, run it for two quarters, then look at what it kept getting wrong. The model is a statement about what your business believes creates value, and nobody outside the room knows that better than the people in it. What does not change with experience is the discipline around it: one model for reporting, named on every number, changed only on purpose.
Three questions that pick the model for you
Model selection turns into a philosophical discussion very easily, and philosophical discussions with six people from three departments do not end. Three factual questions cut it short, and you can answer all three from reports.
| Ask this | Where to find the answer | What it decides |
|---|---|---|
| How long is the cycle? | Days Before First Purchase, read as a spread rather than an average | The window, and whether a multi-touch model has anything to work with |
| How many touches does a typical sale have? | First touch against last touch in the same table. Little movement means short journeys | Whether to bother. One or two touches makes last touch the honest choice |
| What is the number for? | The decision it feeds: a budget split, channel targets, a board slide | Whether the shares have to add up, which rules participation in or out |
The third question gets skipped most and matters most. A number used to split a budget has to come from a model whose shares add up to one sale, or the percentages you hand to finance will not add up to 100. A number telling a brand team which channels appear in successful journeys should come from participation, and forcing it into a model that adds up will answer a question nobody asked.
Deciding what the number is for takes a minute and removes most of the disagreement, because most arguments about models are really two people describing two different jobs.
Some channels open, some channels close
Picking one reporting model creates one predictable unfairness, and it is worth heading off before a channel owner finds it and takes it personally.
Whatever model you choose will favour one kind of channel. Last touch flatters everything that closes and starves everything that introduces. First touch does the opposite. U-shaped is kinder to both ends and unfair to anything whose contribution is genuinely in the middle, which is where most content marketing sits. That is not a fault in the model. It is what picking a rule means. It becomes a problem only when a channel's budget is decided by a number that was never meant to describe that channel's job.
The fix is a second number, and it is one subtraction. Build first touch orders and last touch orders on the same dimension and window, subtract the second from the first, and rank the result.
Channels with a big positive number are openers. They do the expensive work of reaching people who had never heard of you. Channels with a big negative number are closers. They convert demand that already existed. Both are necessary and they are not comparable to each other. Cut your openers because they close badly and you will feel it a quarter later.
Direct sitting at the far right of that picture is normal, and it usually means Direct is collecting credit for demand that something else created.
Do not try to match attribution to the order system
Within about a month of your first credible attribution report, somebody in finance will put it next to the order system and ask why they do not match. How you handle that decides whether the next year includes a data quality project that finds nothing.
They are not supposed to match. The order system records transactions, which are facts, and it is the record of how many orders exist and what they were worth. The attributed report records shares of those transactions, split by a rule. No setting will make a rule agree with a ledger.
Under last touch the totals happen to line up, which is comforting and slightly dangerous. It teaches everyone that reconciliation is normal, so the first move to a multi-touch model looks like a data problem.
Say the harder version early, because it saves a lot of wasted work. If analytics is being used as the book-keeping system for revenue, something has gone wrong that attribution will not fix. The two systems will differ for healthy reasons that have nothing to do with attribution. Consent and tracking prevention remove hits. Cancellations and returns are handled differently. Test orders and internal traffic are filtered in one place and not the other. Attribution then splits whatever survived all that.
The framing that works with finance is simple. The order system tells you how much money there was. Analytics tells you what caused it. A company needs both, from the systems built to give them.
Moving from last touch to any multi-touch model changes every channel number on the same day. If people discover that rather than being told, they will read it as a fault. Send the comparison first, showing both models over the same closed quarter, name the date you are switching, and put an annotation on the affected projects so the step in the trend line is explained inside the tool. The analysis takes an afternoon. Skipping it is how a correct improvement gets rolled back by people who were not warned.
Write the decision down where people will find it
A decision that lives in one analyst's head is a habit, not a standard, and habits leave when people do. The two dashboards at the top of this page were not built by careless people. They were built by two teams who had nothing to read.
Four places are worth using, and together they take under an hour.
The metric name is the most effective, because it travels with the number into exports, slides and forwarded emails read by people who will never open Workspace. A calculated metric called Orders, U-shaped, 60 day, Visitor cannot be misread. One called Orders can.
The project description is second, holding the house standard and the date it was adopted. An annotation on the switchover date is third, and it is the only one of the four that appears attached to the point on the trend line where the numbers moved. The fourth is your implementation documentation, where the reasoning belongs and not just the setting, because the next person needs to know the cycle was measured at 68 days and where that came from.
Curating your components so people find the approved metrics is what makes the standard hold in practice, and that is covered in Curation and Templates. Naming conventions, and the habit of building a small deliberate set of metrics rather than a sprawling one, belong to Calculated Metrics Best Practices. All of it applies here. Attributed metrics multiply faster than any other kind.
Follow along: build the standard set
The output of this decision should be a few named objects rather than a document nobody reads. Built once, they make the standard the easiest thing to use, which is the only way a standard survives a deadline.
- Part one, the approved metrics
-
In
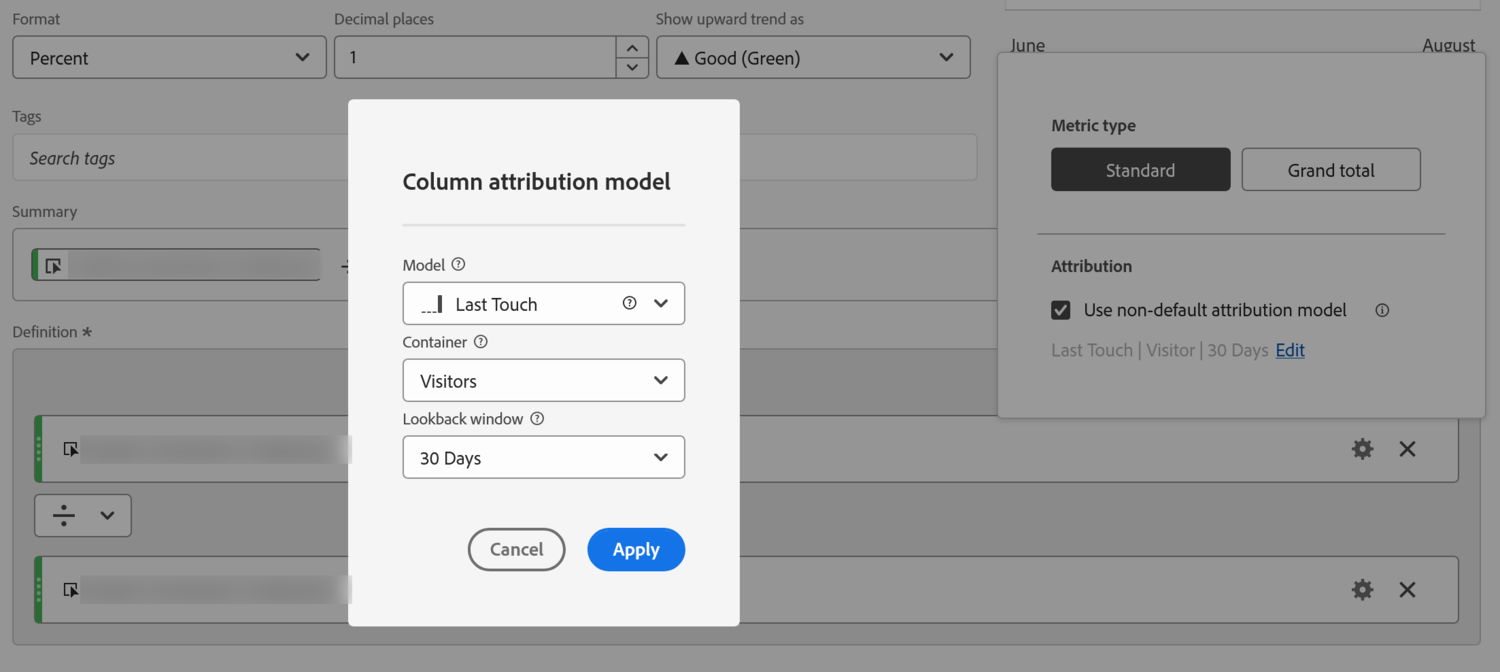
Components›Calculated metrics, create the house metric. Drag in your success event, open its settings, and set the model, container and window you chose. Name it with all three:Orders, U-shaped, 60 day, Visitor. - Fill in the description field: why this model, the measured cycle behind the window, and the date it was adopted. This shows on hover throughout Workspace, so it is the documentation people read by accident.
- Create two diagnostic metrics beside it, first touch and last touch on the same window. Name them the same way. These are for comparing, not for reporting.
-
Create a fourth: first touch orders minus last touch orders.
Call it
Opener or closer, 60 day. Positive is an opener. This one metric settles most channel arguments. - Part two, make it the easy option
- Build one project holding the house table, the opener and closer ranking, and an Attribution panel for exploring. Put the house standard and its adoption date in the project description.
- Curate the project so those four metrics are the ones a reader can reach, then share it as a template. Curation is what stops the next person dragging in a plain Orders and quietly going back to the default.
- Add an annotation on the date the standard was adopted, scoped to the affected report suite. In a year this will be the only thing that explains the step in the trend line.
There is nothing else to set up. Four metrics, one project, one annotation. Everything beyond this is investigation, and investigation can use any model it likes as long as it says which one.
Consistency beats a perfect model
Attribution splits the credit for a sale using a rule, because the data records what happened and never why. The rule works on dimension values sitting on hits inside a window it is allowed to reach back through. So your implementation decides what attribution can ever see, and the window decides what exists.
Eleven models come down to three shapes, two of which add up and one of which does not. Underneath them, one touch point takes everything whatever you picked, and two touch points fall back to simpler splits. The window is something to measure from your buying cycle rather than argue about, and it stops at 90 days.
The choice itself is a governance decision dressed as an analysis one. One model and one window for anything that trends, every other model available for investigating, the model named on every number that leaves the building, and changes made deliberately with an annotation. Get that right with an average model and your reporting works. Get it wrong with the perfect model and nobody can check anything.
The habit worth keeping outlasts this product. When two people disagree about an attributed number, they are almost never disagreeing about data. Stop defending the number and ask each of them what they think creates value. That conversation is the actual work. The tool just applies whatever you agree.
It is worth knowing that the tool moves too. In Customer Journey Analytics these same models sit on the metric rather than on the report, and the ninety day ceiling is not the same ceiling. The settings change. Knowing that a model is a rule you chose, that the window decides what exists, and that somebody has to write the decision down, does not.
Marketing channels are where most of this gets applied, and they have their own rules about which channel is allowed to claim a visitor in the first place, decided at collection time before any model runs. Channel Attribution covers that case, including why the Marketing Channel dimension leaves every model open to you while First Touch Channel and Last Touch Channel have already decided for you.
Analytics > Components > Calculated metrics is where a house model becomes an object other people can use. Attribution is set per metric inside the builder, on the metric in the definition, not on the calculated metric as a whole.
Annotations are created in Workspace from the Components panel, or by selecting a point on a trended chart. Curation and template sharing sit under Share in the project menu.
This article focuses on the concepts, architecture, and practical guidance behind the topic. For the latest UI walkthroughs and step-by-step implementation instructions, use the links below. They leave this site and open Adobe's own documentation in a new tab.