Analyze the data › Analysis Workspace
Fallout and Flow Analysis
Somewhere in every company there is a diagram of how the website is supposed to work. Home, category, product, cart, checkout, done. It was drawn on a whiteboard during a project two years ago, it made its way into a requirements document, the pages were built to support it, and by now everybody talks about it as though it were a description of what happens rather than a plan for what should.
An analyst is asked to check whether the checkout is working, so they build a funnel from those steps and it comes back at nine percent. That is low, but funnels are always low, so the meeting concludes that checkout needs work and somebody starts scoping a redesign. Six weeks later, a different analyst looking at something else entirely notices that the second most common thing people do after the product page is go back to search, which is not a step in anybody's diagram, and that the people doing it are not lost at all. They are comparing products, and the site is not helping them do it.
The first analyst answered the question they were asked, correctly. They just answered it with a tool that can only ever confirm or deny the route it was handed, and the route was the problem.
Two visualizations sit next to each other in the menu for exactly this reason. They both draw boxes joined by lines, they look like variations on one idea, and they answer opposite questions.
One of them tests a belief, the other produces one
That difference is the whole thing, and it decides which one you should be opening before you touch either.
The rule that comes out of that is short enough to apply without thinking about it. If you can name the steps in advance, use fallout, because you have a hypothesis and fallout is a test. If you are surprised by something and cannot explain it, use flow, because you do not have a hypothesis yet and flow is where one comes from. In real investigations they turn up in that order about an hour apart, since a fallout is very good at telling you where people left and almost completely silent about where they went instead.
Fallout, and the steps that need not be pages
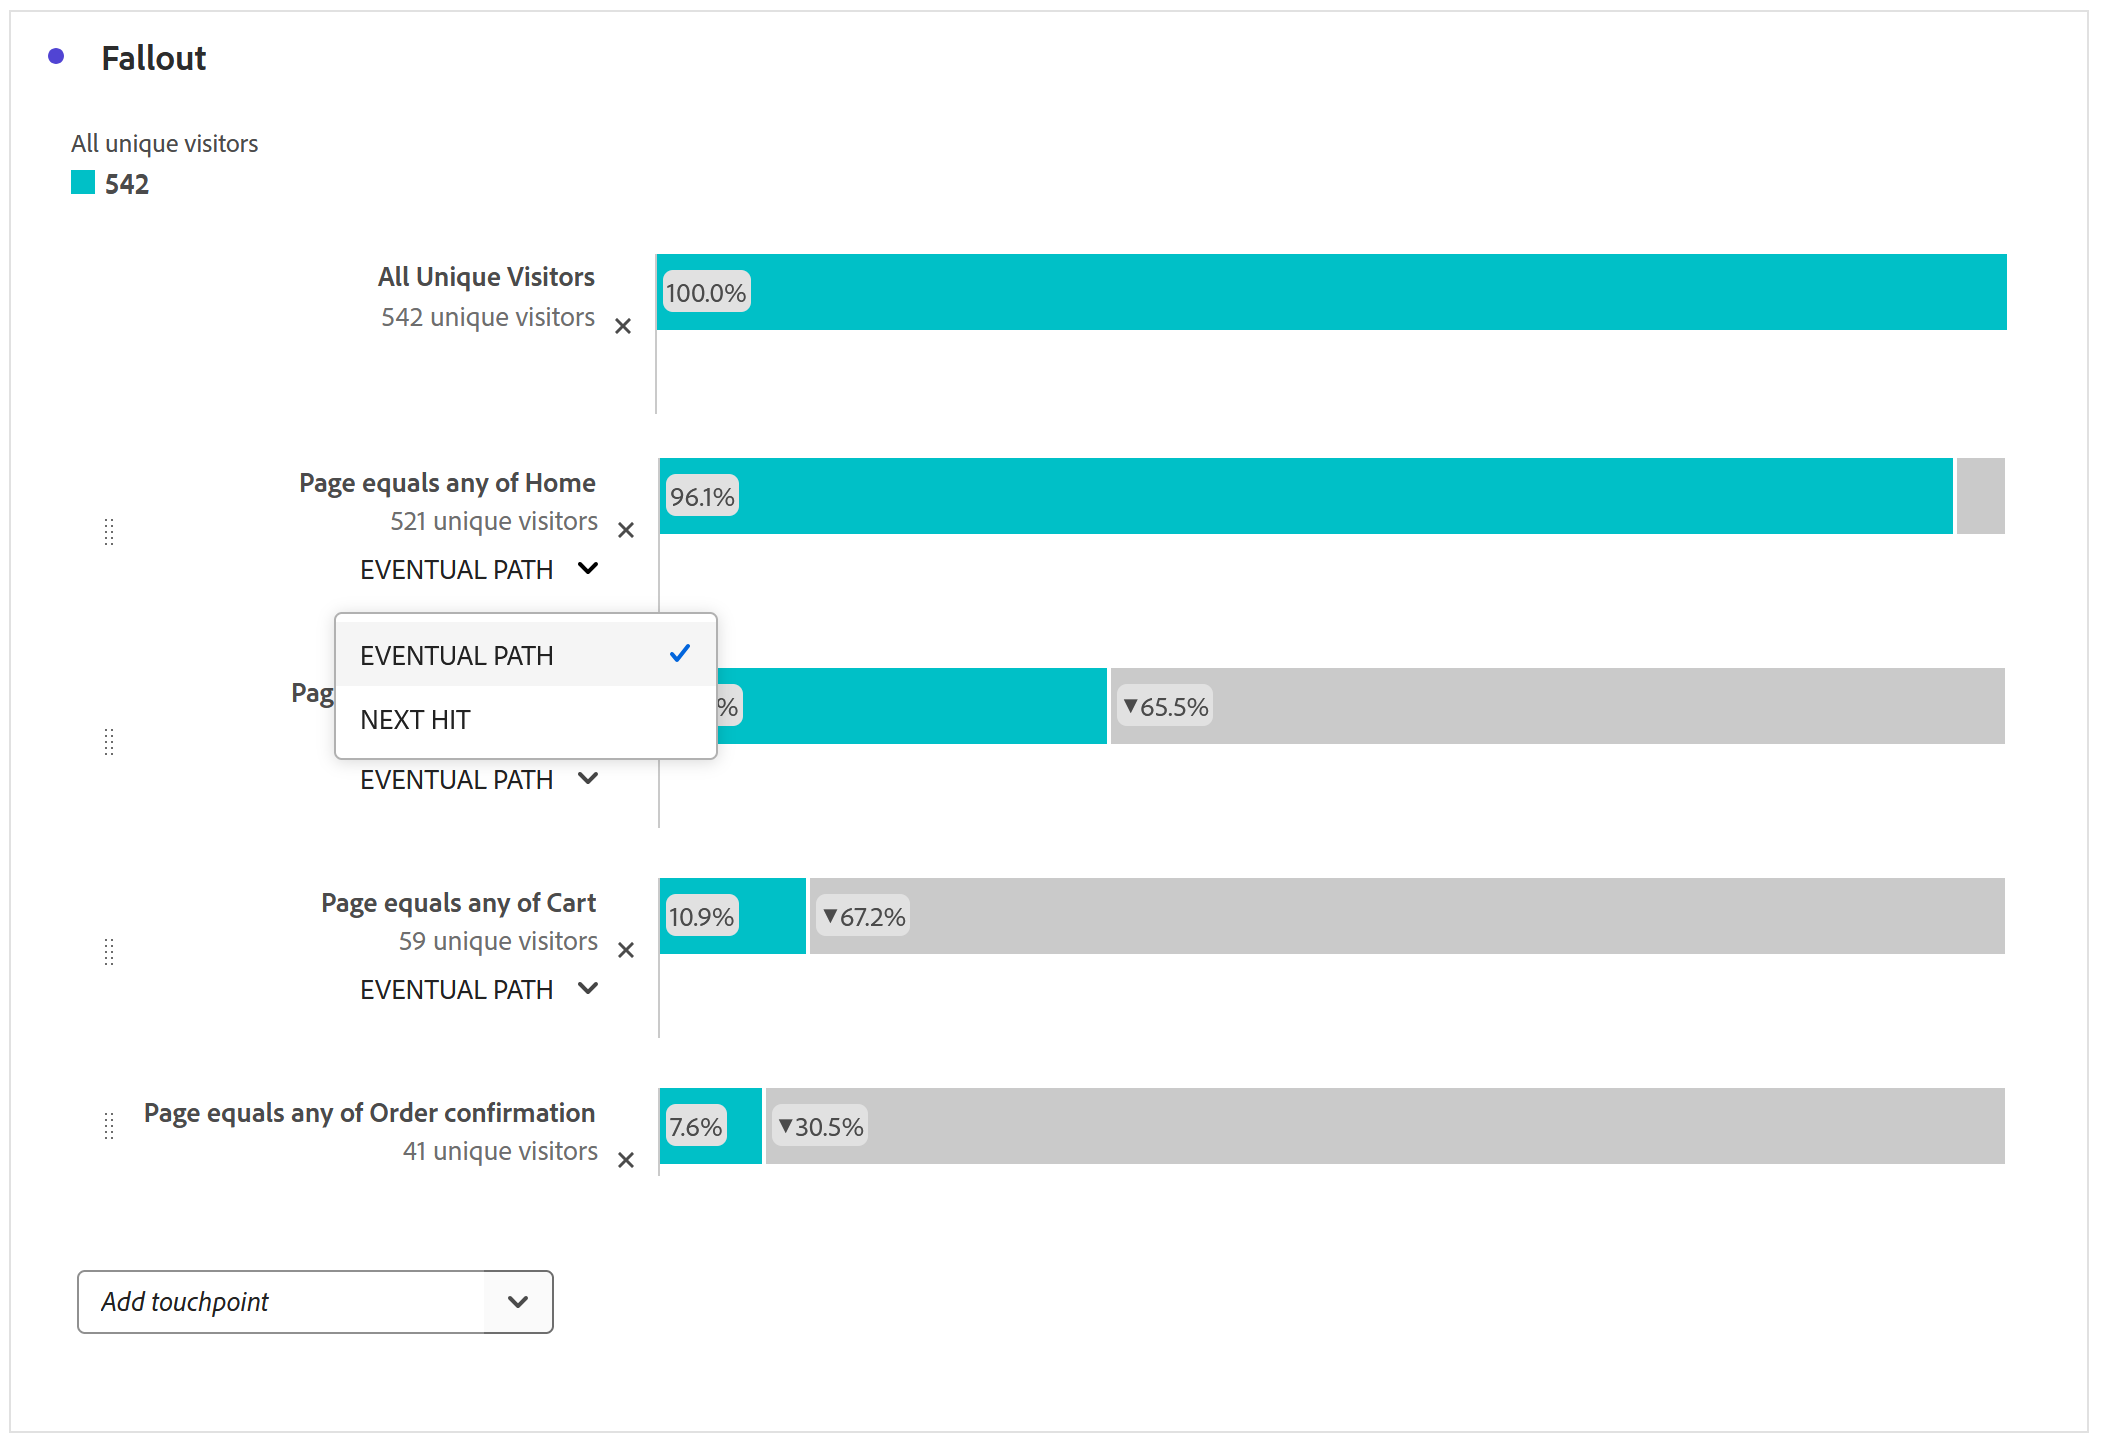
A fallout is a list of touchpoints in an order you choose, and the visualization reports how many people made it from each one to the next. That much is obvious from looking at it.
What is less obvious, and what most people never use, is that a touchpoint does not have to be a page at all. Any dimension value can be a step, any metric can be a step, and any segment can be a step, and all three types can be mixed freely inside the same funnel. That turns fallout from a page-sequence report into something considerably more interesting: saw a product, used internal search, was a returning visitor, placed an order. Not one of those is a page, and it is a perfectly valid funnel that answers a question no page sequence could express.
There is also a small thing worth knowing about what to do when a step drops sharply, because it saves a great deal of rebuilding. Right-click that touchpoint and Workspace will generate a segment containing exactly the people who fell out there, ready to drop straight into a panel and interrogate. That is the shortest route this product offers from noticing a problem to studying the specific people it happened to, and it takes about four seconds.
Eventual path or next hit, and the same funnel gives two answers
Underneath every touchpoint sits a small selector that a great many people have never opened, and it changes the meaning of the entire diagram above it.
Eventual path, which is the default, asks whether somebody reached the next step at any point afterward. They can wander through forty other pages, leave, come back the following day, and still be counted as having passed. Next hit asks whether the next step happened immediately, on the very next hit, with nothing in between at all. Both are legitimate questions, both are useful, and they produce dramatically different numbers from identical data.
Eventual path counts anybody who arrived in the end, however long they wandered and however many times they escaped and came back. For a question like "did these people eventually buy" that is exactly right. For a question like "does this three-step checkout work" it is close to useless, because a checkout people abandon and re-enter twenty minutes later scores as a success and the broken step never surfaces. The number will be comfortably high, nobody will query a comfortably high number, and the redesign will get scoped against a figure that was never measuring what the room thought. When the funnel is a designed sequence people are meant to move straight through, set the intermediate touchpoints to next hit and expect the figure to fall, sometimes by a great deal. That drop is not a worse result, it is the result the previous setting was hiding.
The container decides whether tomorrow still counts
One more setting sits above the whole funnel rather than under a single touchpoint, and like the last one it defaults to the more generous reading.
Fallout runs at visitor level unless you change it, which means somebody can see the product page today, disappear entirely, come back eleven days later and complete the purchase, and the funnel counts that as one uninterrupted journey. Switching the container to visit confines the whole sequence to a single session, so anybody who left and came back starts again.
Which of those is correct depends completely on what is being bought. For a considered purchase that genuinely takes people several days of thinking, visitor is the honest setting and visit will make a perfectly healthy business look broken. For a checkout that should take ninety seconds, visitor is flattering to the point of being misleading. The mistake worth avoiding is not picking the wrong one, it is never noticing that a choice was made on your behalf.
Flow, and the routes nobody would have thought to test
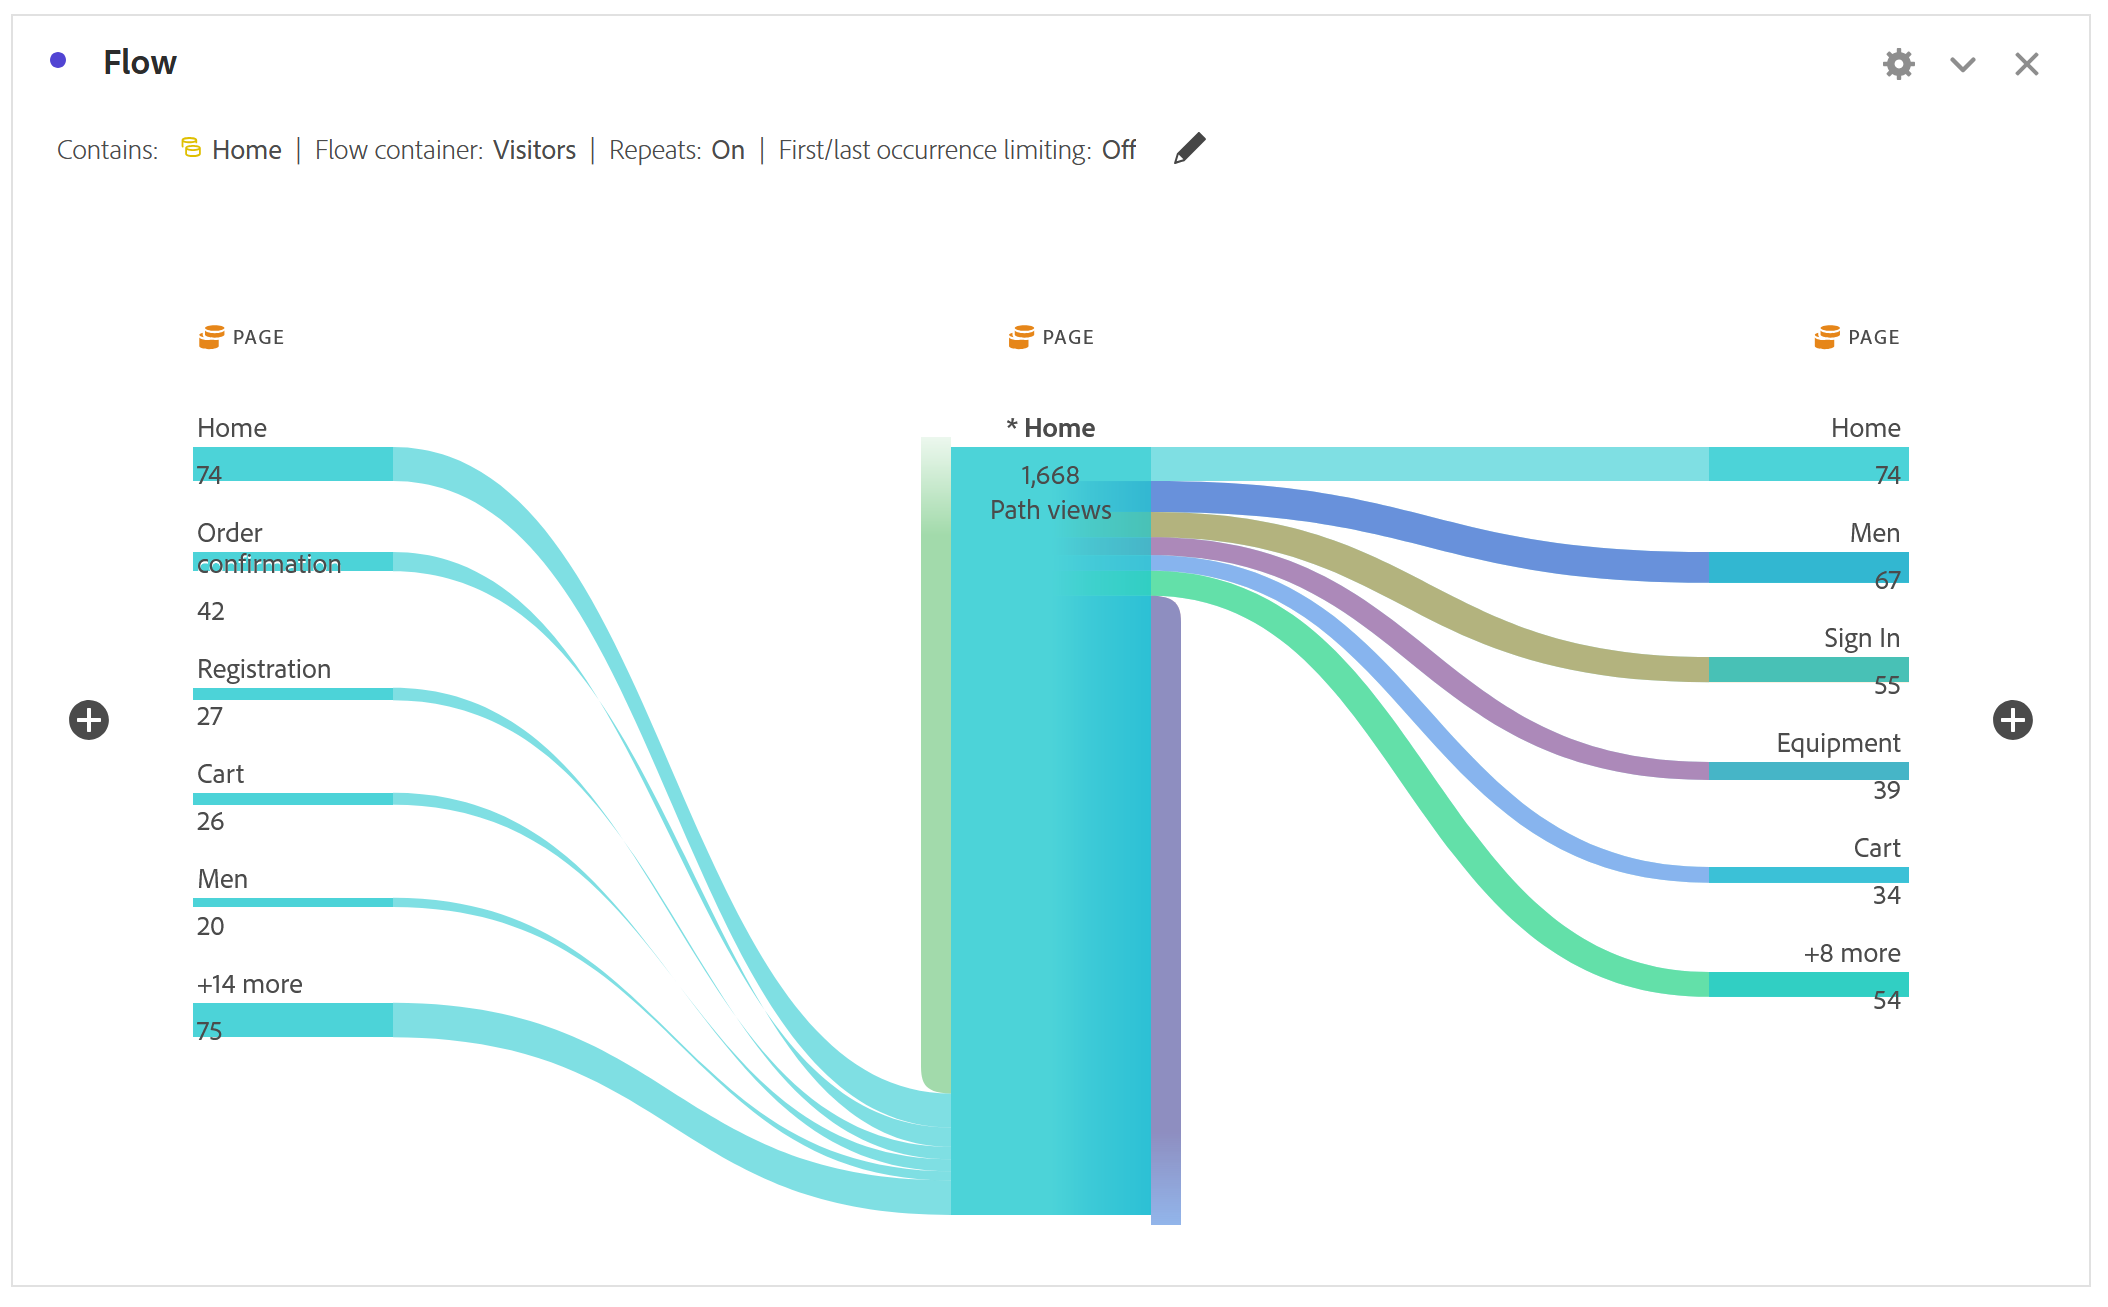
Flow starts from a single point and expands outward in both directions, showing what came immediately before and what came immediately after, with the thickness of each path reflecting how many people took it.
Its whole value is in the routes you would never have put into a funnel, because a fallout can only ever confirm or deny a path somebody already suspected. Flow is where you find the loop between two pages that people bounce between because neither answers their question. It is where you find that the most common thing after the product page is another product page, which is a browsing pattern rather than a purchasing one and changes what the page is for. And it is where the analyst in the opening of this section would have found the search-again behavior six weeks earlier than they did.
Two settings decide whether the diagram is readable at all, and the first of them is responsible for most flow diagrams being abandoned as incomprehensible.
Repeats, and the reload that swallows the diagram
Websites reload constantly. A filter re-renders the page, pagination fires another view, a form validation error redisplays the screen somebody was already on, a tracking implementation fires twice on a single-page application route change. Every one of those produces a hit carrying the same page value as the hit before it.
With repeats switched on, the single most common path out of any page becomes that same page again, and it dominates everything else in the diagram. The picture is technically accurate and analytically useless, because the movement you came to look at is buried underneath a self-referential loop that describes the site's rendering behavior rather than anybody's journey.
Switching repeats off collapses consecutive identical values into one, and the flow becomes a picture of movement between different things, which is what everybody meant in the first place. Check that setting before reading any flow diagram somebody hands you, because the two versions look equally authoritative and only one of them is about people.
At visitor level, hits are joined across visits, which means the page shown as coming next after somebody's final page of the day is their first page of the following visit, possibly days later. Those paths are technically real and almost never what anybody means when they say journey. Visit level stops the chain at the session boundary, which is usually the right reading for on-site behavior. As with fallout, the default is the generous one, and as with fallout, the setting is invisible in the diagram itself.
Both refuse calculated metrics, and both deserve reading with suspicion
Fallout will not accept a calculated metric as a touchpoint, for the same reason the cohort table refuses one: a step has to be something an individual person did, and a formula evaluated over already-assembled rows cannot be tested against an individual. The way through is the same as well, which is to reach for the underlying event rather than the ratio built on top of it.
Past that specific limit, both visualizations share a habit worth naming plainly. They produce diagrams that look like evidence, and are in fact the output of three or four settings: path type, container, repeats, and whatever segment sits on the panel around them. To Adobe's credit those settings are on screen if you look. A fallout prints the path type under every touchpoint, and a flow spells out its container and repeat handling in a line across the top. What they do not survive is travel. Crop the diagram for a slide and the settings are gone, quote the percentage out loud in a meeting and they were never there, and at that point the number has stopped being a measurement and become a claim.
Follow along: build the funnel, then take its settings apart
These settings are worth changing one at a time on a funnel you built yourself, because the size of the swing is the part that stays with you and no description of it does the job.
- Part one, the funnel
- Drag
Visualizations›Falloutinto a panel with a decent date range. - Drag three or four steps into it, in order. Pages are fine to start. Note the percentage at each step.
-
Now add a step that is not a page — a segment, or a metric like
Orders. Mixing types is allowed, and it is the capability most people never use. - Part two, the settings that move the answer
-
Under an intermediate touchpoint, switch
Eventual pathtoNext hit. Write down how far the percentage falls. That gap is the difference between “got there eventually” and “went there”. -
Change the container from
VisitortoVisit. It falls again. Decide which of the two actually matches the purchase you are measuring. - Right-click a step with a big drop, create a segment of the people who fell out there, and drop it into a new panel. Four seconds from noticing a problem to studying the people it happened to.
- Part three, the other question
- Drag
Visualizations›Flowin, focused on the page with the biggest drop. -
Open
Settings›Repeats, and switch it on, then off. On, the busiest path is usually the same page again. Off, the diagram becomes about movement. Only one is readable. - Read the paths out of that page and compare them with your funnel. This is the step where you find out whether the route on the whiteboard exists at all.
There is nothing else to configure. Path type, container, repeat instances. Three settings, and every one of them defaults to the more generous reading.
That is the shortest useful version rather than the complete one. Steps 4 and 5 are the pair worth doing on real data, because a funnel that reads sixty percent on the defaults and twenty-two percent under next hit and visit is the same funnel over the same people, and somebody is about to make a decision on one of those two numbers.
What you have now
Fallout takes a sequence you define and reports survival through it, so it tests a hypothesis and can only ever confirm or deny the route it was handed. Flow takes a single point and reports the routes that actually existed around it, so it generates hypotheses and shows you the behavior nobody designed. Most real investigations use them in that order, an hour apart, and the mistake in the story at the top of this section was reaching for the first one and stopping there.
The point worth carrying past both of them is that these diagrams are the output of settings the diagram does not show. Eventual path against next hit. Visitor against visit. Repeats on or off. Every default is the generous reading, every alternative produces a smaller and usually more honest number, and none of that survives a screenshot into a slide. A funnel percentage quoted without its settings is not a measurement of anything, it is a claim that happens to have a number attached.
A mature project can be carrying funnels, cohorts, a dozen freeform tables and several breakdowns, and it is entirely legible to the person who built it and close to unreadable for anybody else. Before dealing with that, there is one more thing Workspace can do that no chart you build yourself will: instead of you deciding what to look at, it can tell you what changed. Anomaly Detection and Contribution Analysis covers what those statistics really claim, and where they stop.
Analytics > Workspace, then the Visualizations icon in the left rail. Fallout and Flow sit near the top of the list, just below Freeform table and Cohort table.
The eventual path and next hit selector appears underneath each touchpoint in a fallout rather than in the visualization settings, which is why it goes unnoticed. Container, repeats and the rest of the flow options live behind the gear on the visualization, and a flow prints its current settings in a line across the top of itself.
This article focuses on the concepts, architecture, and practical guidance behind the topic. For the latest UI walkthroughs and step-by-step implementation instructions, use the links below. They leave this site and open Adobe's own documentation in a new tab.