Analyze the data › Calculated Metrics
Building Calculated Metrics
A room has finally agreed that the conversion rate is orders divided by visits. Everybody nods, somebody writes it down, and the argument is declared over.
What they have agreed on is a calculated metric: two metrics already being collected, one operation between them, saved under a name and evaluated every time a report runs. Nothing gets deployed and nothing gets stored, which is why the whole thing takes minutes.
It is also not over. That sentence still has at least four different meanings inside the builder, and choosing between them takes four clicks nobody in the room knew existed.
Each of those is a clean number that looks exactly as authoritative as the others, and any of them can end up in a dashboard called Conversion Rate. The rest of this section is about the controls that decide which one you saved.
Conversion rate is not one number, it is a family
Before any of the controls matter, there is a question underneath them that most teams never make explicit. There is no universally accepted definition of conversion rate. There never has been, and any site of reasonable size needs several.
The reason is visible the moment the journey is drawn out. A visitor arrives, looks at products, adds something to a cart, starts a checkout, and orders. Every one of those is a metric being collected. Pick any two of them and the ratio between them is a conversion rate, measuring a different stretch of the same journey.
Notice what keeps repeating in those labels. Per 100 visits. Per 100 cart additions. The hundred is not decoration, it is the whole reason a rate is legible: expressing a ratio out of a hundred is how a percentage gets inferred, and a percentage is what makes two unequal things comparable. It is also why the format setting further down this page matters more than a formatting option usually would.
The rates anchored on visits measure the entire journey, so they move when anything at all changes, from an ad campaign to a checkout bug. The rates anchored deeper measure one step in isolation, which makes them far better for diagnosing where a problem actually is. A drop in orders per hundred visits tells you something is wrong. A stable cart addition rate with a collapsed checkout rate tells you where.
The practical consequence is that an organization does not need one conversion rate, it needs a small set of them, deliberately chosen, named so they cannot be confused, and published so that everybody quotes the same ones. Which of them gets to be called "the" conversion rate is a decision somebody has to make and write down. That is not a reporting problem, and it is picked up in Calculated Metrics Best Practices.
The canvas, and the five things you can put on it
The builder is a drag and drop canvas rather than a formula box, which is either liberating or annoying depending on the day. Five kinds of thing can land on it.
Metrics. Standard metrics, Adobe defined metrics, and other calculated metrics. Yes, a calculated metric can contain a calculated metric, which is powerful and is also how dependency chains nobody drew come into existence.
Operators. Divide, multiply, subtract, add. One appears automatically between any two components, and it defaults to divide. That default is not laziness on Adobe's part: division is the operation that produces something the two originals could not express, which is a rate, and a rate is what makes unequal things comparable. Most of what you build here will be a division.
Segments. Dropped into a container, a segment restricts what the metric inside it counts. This is the feature that makes the whole module worth reading, and it gets its own treatment below.
Functions. Statistical and structural operations wrapped around a metric: sums down a column, means, medians, percentiles, distinct counts.
Static numbers. A literal value. Multiply by 100, divide by 1000, subtract a target. Small and occasionally exactly what is needed.
Containers nest all of this. A segment container applies a filter to whatever sits inside it, a function container applies a function, and a plain container exists only to force an order of operations. That last one matters more than it looks: arithmetic without explicit grouping is arithmetic somebody will misread.
The denominator is the entire argument
Once the numerator is settled, and it usually is, every remaining disagreement about a rate is a disagreement about what it is divided by. Orders are orders. What divides them is a claim about what the rate is supposed to mean.
| Formula | The question it actually answers | Who asks it |
|---|---|---|
| Orders / Visits | How often does a session end in a purchase | Ecommerce and site optimization. The default, and usually the right one. |
| Orders / Unique Visitors | How many purchases does a person make in this period | Retention and lifecycle. Rises with the length of the date range, which surprises people. |
| Orders / Cart Additions | Once intent exists, how often is it completed | Checkout and payments. A far higher number, and a far narrower claim. |
| Orders / Page Views | Almost nothing worth knowing | Nobody, and yet it gets built, because both metrics were in the list. |
All four are arithmetically valid. Only the first three are meaningful, and they are meaningful to different people. The practical rule is to name the denominator in the metric title rather than trusting anybody to remember it, which is why a library full of metrics called Conversion Rate is a library that has not solved anything.
One trap deserves naming on its own. Dividing by unique visitors produces a number that changes when the date range changes, because a person visiting across two months is one unique visitor over the quarter and two over the individual months. Sum the monthly figures and they will not agree with the quarterly one. Nothing is broken. Unique visitors were never additive.
The same argument runs well outside conversion rate, and bounce rate is the case worth knowing because the convention is not obvious. Bounce rate divides bounces by entries, not by visits. On a page dimension those are different populations: entries counts the visits that started on that page, while visits counts every visit that touched it at any point. Build it against visits and the number comes out lower on every page that is more often passed through than landed on, which is most of them, and it will disagree with the built in Bounce Rate sitting two rows above it in the metric list.
Bounces counts visits containing exactly one hit, not one page. So a visitor who lands, reads nothing, and leaves is not a bounce if a consent prompt, a pop up, or any other tracked interaction fired a second call on that page. Deploy a cookie banner that sends a hit and the bounce rate drops across the whole site overnight, with no change whatever in behavior. Where the question is really about disengagement, build the rate on Single Page Visits instead and say so in the description.
Standard or Total, and why every row suddenly changed
Select the gear on any metric inside the builder and one of the settings is Metric type, with two values.
Standard is the ordinary behavior. The metric is evaluated for each row of the table, so Orders divided by Visits gives each page its own conversion rate.
Total replaces the metric with the grand total for the entire report, held constant on every row. Orders divided by Total Visits gives each page its share of all site traffic, not its own rate. This is how a share of total column is built, and there is no other clean way to build one.
The two settings produce columns that look identical in structure and mean completely different things. A metric intended as a rate, built with Total by accident, produces a column of small percentages that decrease as the table gets longer, which reads as plausible for exactly as long as nobody adds up the column.
A segment inside the metric, and why a panel filter cannot do it
Here is the capability worth the price of the whole feature.
Applying a segment to a panel filters everything in that panel. Every table, every column, every visualization now describes only the people who qualified. That is usually what you want, and it makes one thing impossible: comparing the segment against anything else in the same table.
Fuse the segment into the metric instead and the filter travels with that one column. Revenue sits beside Revenue from New Visitors, in one table, broken down by whatever dimension you please, and the comparison a stakeholder actually asked for is right there instead of spread across two screenshots.
The mechanic is undramatic: drop a segment into a container in the builder, put the metric inside it, and the segment is evaluated at report run time against whatever the report is looking at. Nothing about the implementation changes, and no data is precomputed. What you have built is a column that quietly asks a narrower question than its neighbors.
Both filters apply. A panel scoped to mobile traffic, containing a metric with new visitors fused into it, returns revenue from mobile new visitors, and the column header says nothing about mobile. The number is correct and the label is a lie of omission. This is the most common way a segmented metric misleads, and it never produces an error, because logically there is nothing wrong with asking two questions at once.
A segment inside a calculated metric is a live reference, not a copy. Adobe updates the segment everywhere it is used the moment it is saved, including inside metric definitions. So an analyst tightening one segment for their own project can silently change an approved company metric, in a dashboard they have never opened, for people they have never met. Nothing warns either party. Before editing any shared segment, check what it is embedded in.
Attribution belongs to the metric, when the metric is an attribution question
The same gear that holds Metric type also holds an attribution model and a lookback window. Setting them here means this metric, and only this metric, credits conversions differently from every other column in the table.
Adobe offers a long list of models, from last touch and first touch through linear, participation, U shaped, time decay and algorithmic, each with its own lookback window. What Is Attribution covers what those models mean and when each is defensible, and Lookback Windows covers how far back credit is allowed to reach.
The opinion for a first build is narrow: leave attribution alone unless the metric exists to answer an attribution question. A metric named First Touch Revenue is honest, because its name declares the model. A metric named Revenue that quietly carries first touch attribution is a trap, and the person who finds it will be debugging a discrepancy at the time. Once you have built enough of these to know why a model was chosen, that rule stops being necessary and the question replaces it.
Format is not decoration
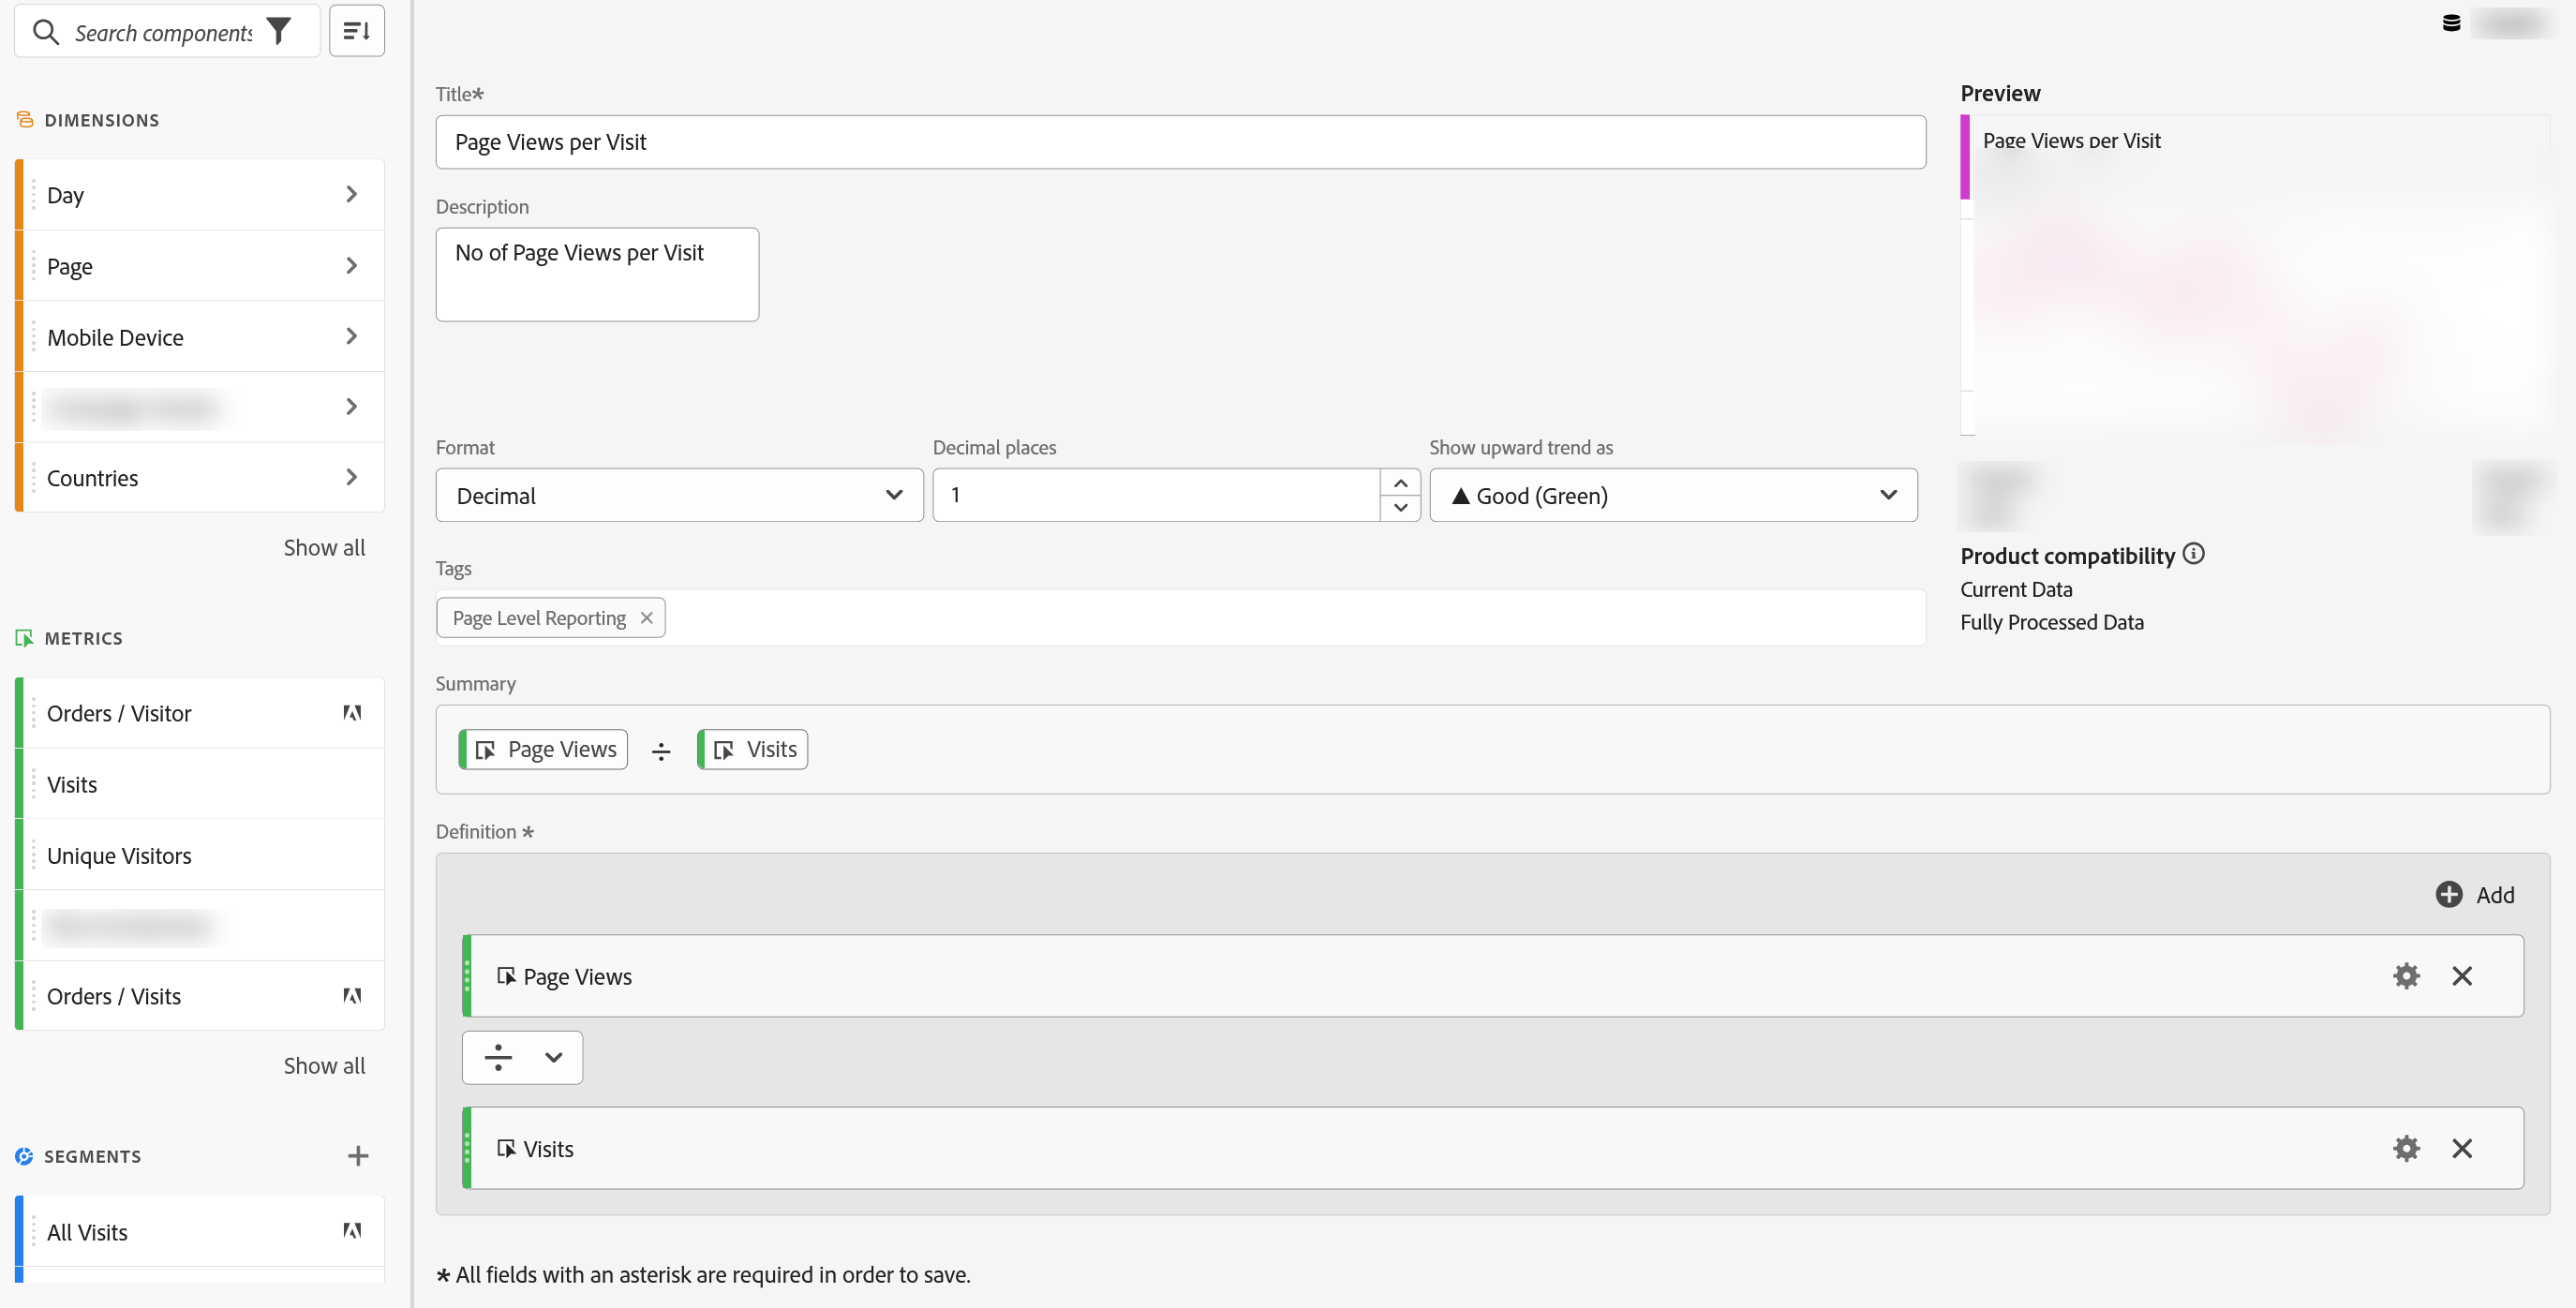
Four format options exist: decimal, currency, percent and time. Percent is the one that gets missed, and it is the setting that turns a bare ratio into the per hundred reading that made the funnel legible earlier on this page. Built without it, a conversion rate displays as 0.021 rather than 2.1 percent, and somewhere downstream a person reads it as two percent, or as zero, or multiplies it by a hundred a second time.
The opposite error is more embarrassing and just as common. Setting the format to Percent and also multiplying the formula by 100 applies the hundred twice, and a two percent conversion rate ships as 210 percent. Build the bare ratio and let the format do its work. If a metric preview comes back in the hundreds, this is the first thing to check.
Two smaller settings sit beside it and are worth thirty seconds each. Decimal places, because a rate quoted to six decimal places implies a precision the data does not have. And the setting that decides whether an upward trend is drawn as good in green or bad in red, which exists because half of all useful metrics are ones you want to go down. Bounce rate, exit rate, average page load, cost per order. Left at the default, a rising bounce rate is celebrated in green on every summary tile in the building.
Functions, and where to stop
The function list is long and mostly statistical: mean, median, percentile, quartile, standard deviation, variance, column sum, row sum, count, round, absolute value. The reference documentation lists every one with its arguments, and copying that list here would help nobody.
Two are worth knowing by name before the rest. Column Sum is what most share of total metrics are built from, dividing a row value by the sum of the column. Approximate Count Distinct returns an approximate count of distinct values in a dimension, which is how a question like "how many distinct customer IDs bought this month" gets answered without exporting anything. Approximate is the operative word, and it belongs in the metric description so that nobody later reports it as exact.
Column Sum carries a property that decides where the metric can be used at all. It sums the column as the table currently stands, not the whole report suite. Change the dimension, add a breakdown, filter the table or let it show a different number of rows, and the denominator moves with it. That is usually exactly what you want, and it is not the same thing as a share of the site total. It also means the metric stops meaning anything the moment somebody drags it into a summary number or a trended table, where the column is no longer a list of dimension items.
One more is worth knowing because it solves a problem every ranked table has. The advanced list includes IF along with the comparison and logical operators, so a rate can be made to return zero below a volume threshold. A page with three visits and one order is not a 33 percent conversion rate, it is noise, and left alone it will sit at the top of the sorted table looking like the best page on the site. Wrapping the rate in a condition that requires, say, a hundred visits before it reports anything makes the table readable without deleting the underlying data. Put the threshold in the metric description, because a reader who does not know it is there will wonder why a row shows zero.
Applying a cumulative average to a rate, such as revenue per person, averages the rates themselves rather than dividing cumulative revenue by cumulative people, and those two answers are not the same whenever the daily volumes differ. Build it as cumulative revenue divided by cumulative people instead. The same reasoning applies to any average of an average: aggregate the parts first, then divide.
Building the metric this section started with
Enough theory. Here is the conversion rate that room agreed on, built so that the agreement survives contact with a report.
Before you start: open Analytics › Components › Calculated metrics › Add.
- Name it so a stranger cannot misread it
-
Set
TitletoConversion Rate (Visits). The denominator is in the name on purpose. It is the only thing that stops a second, different Conversion Rate appearing next quarter. -
Set
Descriptionto “Orders divided by visits. Session level purchase rate. Agreed definition for site reporting.” Not optional. This field is the only explanation a stranger will ever get. - Set
Report suiteto the suite you report on. - Set
TagstoStandardandEcommerce. - Build the definition
-
Drag
Ordersonto the canvas, then dragVisitsbelow it. The operator between them defaults to Divide. Leave it. -
On each metric, open the gear and set
Metric typetoStandard, not Total. LeaveAttribution modelat its default. This is not an attribution question, so do not turn it into one. - Set
FormattoPercent,Decimal placesto1, andShow upward trendtoGood, green. - Check it before anyone else sees it
-
Choose
Preview. The builder charts the last 90 days. A rate that is flat at zero, or that spikes to several hundred percent, is a formula error and not a data story. - Choose
Save. -
Open a Freeform table and put
Orders,Visitsand the new metric side by side. Check two or three rows by hand. Then change the date range and check that the number moves the way a rate should.
Nothing else needs configuring. The metric is now available in every project in the report suite, over all history, immediately.
Those ten steps are a floor rather than a ceiling. They produce one correct, well labeled metric; they do not make anybody an architect of a metric library. Step 10 is the one that gets skipped, and it is the only step that would have caught a wrong denominator before a stakeholder did.
Two things about the environment are worth knowing before saving anything. The builder can keep a metric inside the single project it was created in rather than adding it to the shared library, which is the right choice for genuinely one off analysis and the wrong choice for anything anybody else will quote. And a saved metric applies to all report suites in the login company, so a name that made sense for one brand's suite will be sitting in front of every other brand's analyst tomorrow.
What you can build now, and what you have not solved
The mechanics are finite and they fit on one page: components on a canvas, an operator between them that is usually a divide, a gear holding metric type and attribution, a container holding a segment, a format that decides how the number reads. Everything the builder can express is some arrangement of those parts, and the four numbers at the top of this page were all produced by moving two of them.
What none of it solves is the problem that arrives about eighteen months later. Every one of these metrics is cheap to make, immediate, and permanent unless somebody deletes it, and a feature with those three properties always produces the same end state: a library nobody trusts, containing four metrics with almost the same name, at least one of which is quietly wrong. Calculated Metrics Best Practices is about the arithmetic that fails silently, and about keeping a library that a stranger can still use.
Analytics > Components > Calculated metrics > Add opens the builder from the manager.
Inside a project, the same builder opens from the Add control in the Metrics section of the left panel, from Components > Create metric, by right clicking a metric column header and choosing to create a metric from the selection, or with Shift + Ctrl + C on Windows and Shift + Cmd + C on Mac.
This article focuses on the concepts, architecture, and practical guidance behind the topic. For the latest UI walkthroughs and step-by-step implementation instructions, use the links below. They leave this site and open Adobe's own documentation in a new tab.