Analyze the data › Attribution Models
Lookback Windows
A subscription business runs its first attribution report in January. Paid social comes out badly. It sits below organic search, below email and below Direct, bringing in about 4% of new subscriptions while taking about 20% of the budget. Two people rebuild the report and get the same answer.
Paid social is cut in February. Nobody objects, because the number was clear and had been checked twice.
By April new subscriptions are down 11%, and the drop is among people who had never visited the site before. The channel that was contributing nothing had been bringing in the top of the funnel all along.
The report was not wrong about what it measured. It was set to a 30 day lookback window, and the typical subscriber in that business took 68 days from first visit to paying. For most of those journeys the paid social click happened before the window opened, so the model never saw it. A touch point the model cannot see does not exist.
The window is not your report's date range
Most people meet the lookback window and assume it filters the report, as if it means "only count recent touches". It is closer to the opposite. The window lets attribution reach backwards, outside your report's date range, to find touch points the report is not otherwise showing you.
Take a report covering January. Someone subscribes on 5 January, so that sale is inside your date range and counts once in your total. With a 30 day window, the model then walks back from that sale to 6 December and collects every hit where your dimension had a value. Most of what it finds happened in December.
Those December touch points get credit inside a report headed January, even though December is not in your date range. A normal report of the same period would never mention them. So the date range decides which sales are counted, and the window decides how far back the credit for those sales can travel.
The 20 November touch in that picture is not counted as small, and it is not flagged as missing. It is simply absent, and every share in that row is worked out as though it never happened. Widen the window to 60 days and it comes back, changing all the numbers without any data changing.
The same thing happens in the other direction. A touch point that comes after the sale gets nothing, because credit only ever flows backwards. So a channel that ran a big campaign in the last week of January will look weak in a January report if most January sales happened before the campaign started. It will then appear to work in February. That is not a delay in the data.
The container can cancel your window
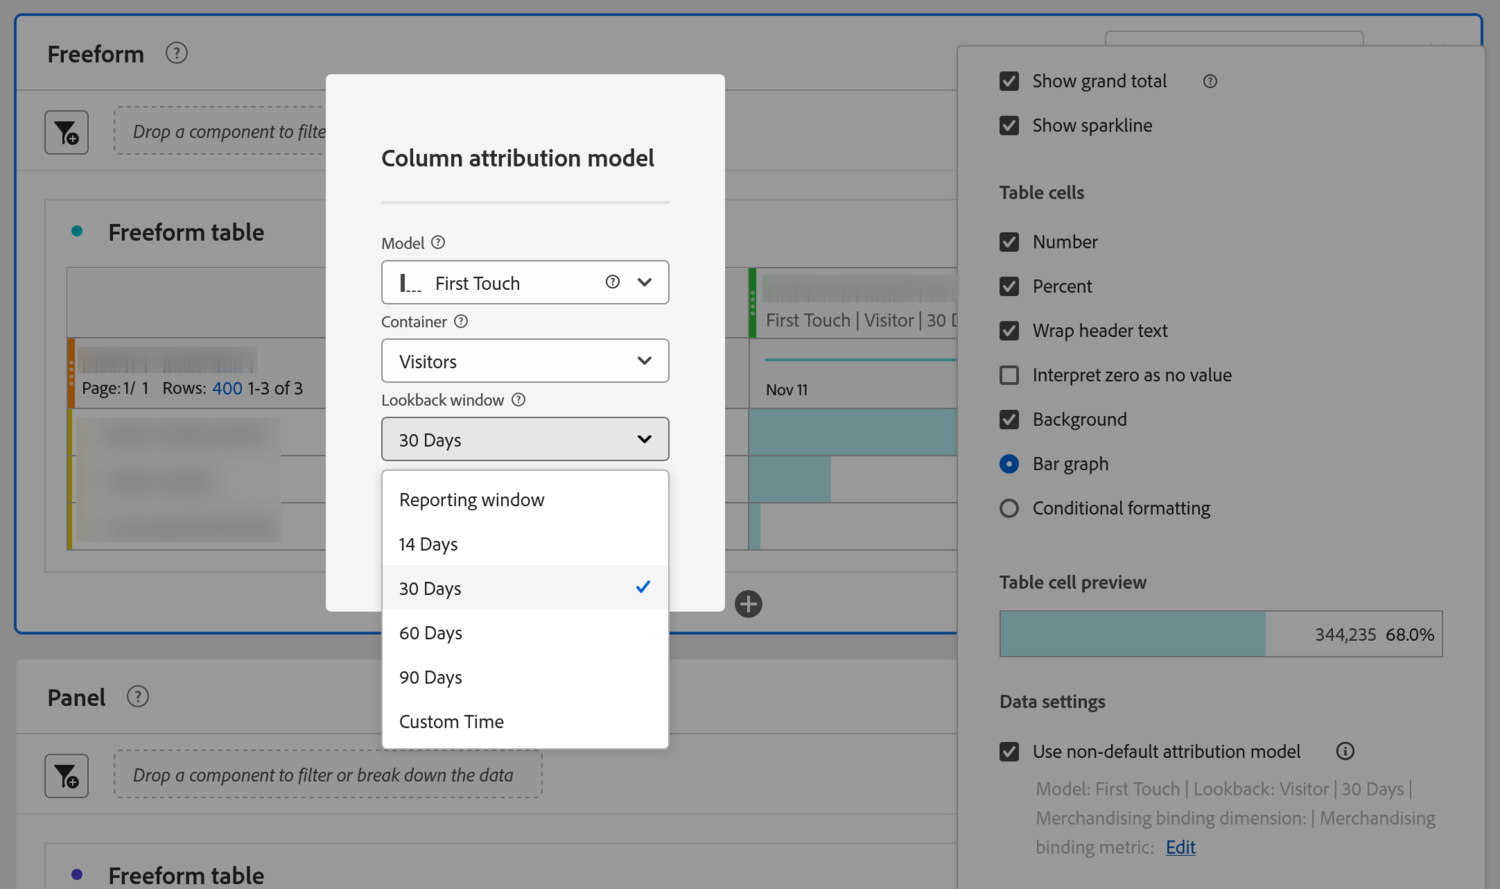
Just above the lookback window there is a second setting called the container. It has two options, Visit and Visitor, and picking the wrong one can cancel your window without telling you.
Visitor means the model can look across all of that person's visits. This is what you want for most attribution questions, because a journey that runs over several weeks runs over several visits by definition.
Visit means the model only looks inside the single visit where the sale happened. Credit is shared among touch points from that one session and nothing else. That is a fair question to ask, but it is a much narrower one.
Here is the part that catches people. If you choose Visit, Adobe locks the lookback window to your reporting window, and the 90 days you carefully set stops doing anything. No warning appears. The report looks normal. A setting that reads "U-shaped, Visit, 90 days" looks deliberate, and the 90 days in it is doing nothing at all.
If you want multi-touch attribution over a real buying journey, the container has to be Visitor. When you inherit somebody else's project, check the container before you check the model. A Visit-scoped report looks plausible, disagrees with the Visitor version of itself, and keeps the window setting on screen as evidence that somebody thought about it. The giveaway is that first touch and last touch give you nearly the same numbers, because inside one visit most sales have very few touch points.
The None row tells you if the window is too short
Every attributed report has a row called None, and most people filter it out before presenting. It is the most useful row on the page.
None holds the sales that had no touch point for that dimension inside the window. Some of those really are unattributable, like a first-time visitor who arrived with nothing captured. But a big None row on a channel report usually means something more specific: your journeys are longer than your window. The touch points exist and were collected correctly. The model is just not allowed to reach them.
So you can use None as a test. Build the same report at 30 days and at 90 days and watch that row.
If None drops a lot as the window widens, the shorter window was hiding real journeys, and anything you concluded from it was based on part of the evidence. If None barely moves, the window was already long enough, and those sales are unattributable for some other reason. That is usually a gap in your implementation rather than a problem with the report.
Measure your buying cycle, then set the window
The window is usually chosen in a meeting, based on how long people feel customers take to decide. It does not have to be. Adobe ships two dimensions that answer the question directly, and hardly anyone uses either.
Days Before First Purchase gives you the number of days between a visitor's first arrival and their first purchase. It fills in automatically wherever the purchase event is implemented. Put it in rows, put Orders in the column, and your real buying cycle is on screen.
Time Prior to Event does the same job at a finer grain. It gives you the time between the first hit of a visit and a success event, in buckets from under a minute up to more than fifteen hours. Use it when the decision happens inside one session rather than across weeks.
Read the spread, not the average. Buying cycles are nearly always lopsided: a big group decides quickly and a long tail takes months, so the average sits somewhere neither group actually is. What you want is a percentile. A window covering roughly 80% to 90% of your sales catches most real journeys without stretching so far that old touches start collecting credit they did not earn.
Most companies have several buying cycles that have nothing to do with each other. Somebody replacing a phone charger decides in four minutes. Somebody buying a laptop from the same site takes six weeks. The enterprise contract on the same domain takes a quarter and involves four people. Run all three through one 30 day window and the report is too generous to the first, about right for the second, and blind to the third. Break the cycle down by product category or customer type before you set anything, and expect to end up with two or three windows rather than one. It also answers the person who says attribution is arbitrary, because you can show where the number came from.
Ninety days is the limit
The window setting offers the reporting window, 14, 30, 60 and 90 days, and a custom option that takes minutes, hours, days, weeks, months or quarters. The custom option makes it look as though you can go further, since quarters are on the list and nothing refuses a bigger number. You cannot. Attribution reaches back 90 days at most, and asking for more gives you 90.
This is a real limit, so it deserves a straight answer rather than a clever one. Plenty of businesses have a buying cycle of five or six months. Enterprise software, mortgages, cars and higher education all do. In those cases attribution cannot see the start of the journey, and no combination of settings will change that. What you can do is change the question.
The first option is to attribute an earlier conversion instead of the final one. A trial signup, a brochure download, a quote request or a test drive booking are all real events, they sit much closer to the acquisition touches, and attributing them at 90 days works. You then measure what brings people to the trial, and separately what turns a trial into a contract. That answers the original question in two honest halves.
The second option is to go back to collection-time persistence, which is the thing report-time attribution otherwise frees you from. Give an eVar a long expiration and it holds its value against the visitor in the processed data. A normal report of that eVar against the sale will then credit it, however far back the touch happened.
It gives you first touch or last touch only, it is fixed at whatever was chosen before the data was collected, and it cannot be changed retrospectively. For a journey longer than 90 days it is also the only thing that works, which is the real reason expiration still deserves a proper design conversation in a long-cycle business. Those settings are covered in eVars (Conversion Variables).
Follow along: size the window from your data
This takes about fifteen minutes and gives you a number you can defend, which is a better position than most teams argue from. The first two steps are worth doing even if you never change the window.
- Part one, find the real cycle
-
Build a freeform table with
Days Before First Purchasein the rows andOrdersin the column, over at least a quarter. If the purchase event is implemented, this dimension is already filled in and needs no setup. - Add a percentage column and read down it until the running total passes 80%. That day count is your candidate window. Note the middle value too. The gap between them tells you how lopsided your cycle is.
-
Break the same dimension down by
Product Categoryor a customer type dimension. Expect the answer to split. Two or three windows for two or three cycles is the right outcome. - Part two, test it on the None row
-
Build a table with
Marketing Channelin rows andOrdersin columns, duplicated three times. -
Set all three columns to the same model and to
Visitor, with windows of30 days,60 daysand90 days. Keep the model the same. The window is the only thing changing. -
Find the
Nonerow and read it across the three columns. This is the whole test. If None falls sharply from left to right, the shorter windows were hiding journeys. - Now read across two or three real channels, especially display or paid social. Openers grow as the window widens. Closers stay flat, because their touches were always close to the sale.
- Check where None settles against the percentile you found in part one. The two should roughly agree. If None is still falling at 90 days, your cycle is longer than attribution can see.
There is nothing else to set up. One dimension for the cycle, three columns that differ only by window, and one row read across them. You end up with a window you chose from evidence, which is also the one that survives being questioned.
The window decides what exists
The lookback window is not a filter on your report. It lets credit travel backwards out of your report's date range, and the touch points it finds are often in months your report does not cover. A touch point outside the window is not reduced or flagged. It is absent, and every share is worked out as though it never happened.
The container above the window can cancel it, because Visit locks the lookback to your reporting window while leaving your setting on screen. The None row measures all of this, and watching it move as you widen the window is the cheapest test in this module.
Days Before First Purchase and Time Prior to Event turn the window from an opinion into a percentile, and that usually turns out to be two or three different cycles hiding behind one average. Ninety days is a real ceiling. If your cycle is longer, attribute an earlier conversion instead of pretending the ceiling can be argued with.
What is left is the decision itself, and it is not really an analysis decision. Once you understand the models and have measured the window, three questions are left. Which combination does your company agree to report on? Who is allowed to change it? And how will somebody reading a number in six months know which rule produced it? Choosing an Attribution Model covers that, including the conversation with finance.
The container and lookback settings sit together under the model, in all three places attribution is set: Column settings on a freeform table metric, the metric settings in the calculated metric builder, and the Attribution panel. A metric built in the calculated metric builder defaults to last touch with a 30 day window.
Days Before First Purchase and Time Prior to Event are standard dimensions in the components list. They need no setup beyond having the success event implemented.
This article focuses on the concepts, architecture, and practical guidance behind the topic. For the latest UI walkthroughs and step-by-step implementation instructions, use the links below. They leave this site and open Adobe's own documentation in a new tab.