Analyze the data › Data Warehouse
Creating Data Warehouse Requests
Most first requests are wrong in the same way. Somebody asks for a quarter of data, and rather than work out what they need, the person building it adds every dimension that might be useful and every metric anybody has ever asked for. It seems safe. If it is all in there, nobody has to wait another three days.
The file arrives two days later at several gigabytes, with a row for every combination of six dimensions. Nobody can open it in a spreadsheet. The one number the manager wanted is in there somewhere, spread across eleven thousand rows that need summing first.
Building a good request is mostly about resisting that instinct. You are not exporting data. You are describing one specific table.
A request is a table you describe blind
The difference from Workspace is worth naming, because it changes how you should think while building.
In Workspace you build by looking. You drag something in, see what comes back, and adjust. The report is a conversation, and being roughly right on the first attempt is fine because the second attempt costs you four seconds.
A Data Warehouse request has no second attempt inside the same day. You describe the table completely, submit it, and find out whether you were right when the file lands. So the work moves to the front. Before you open the request form, you should be able to say what one row of the finished file represents.
That single sentence is the most useful discipline in this module. "One row is one search term, for one product category, for one day." If you cannot say it, you are not ready to build the request, and adding more dimensions will not help.
Six tabs, and what each one decides
Tools > Data Warehouse > Add opens a form with six sections. They are not equally important and the middle two do most of the work.
| Tab | What it decides | Watch out for |
|---|---|---|
| General settings | Request name, report suite, date range | The name is what you will search for in a year. Make it describe the contents. |
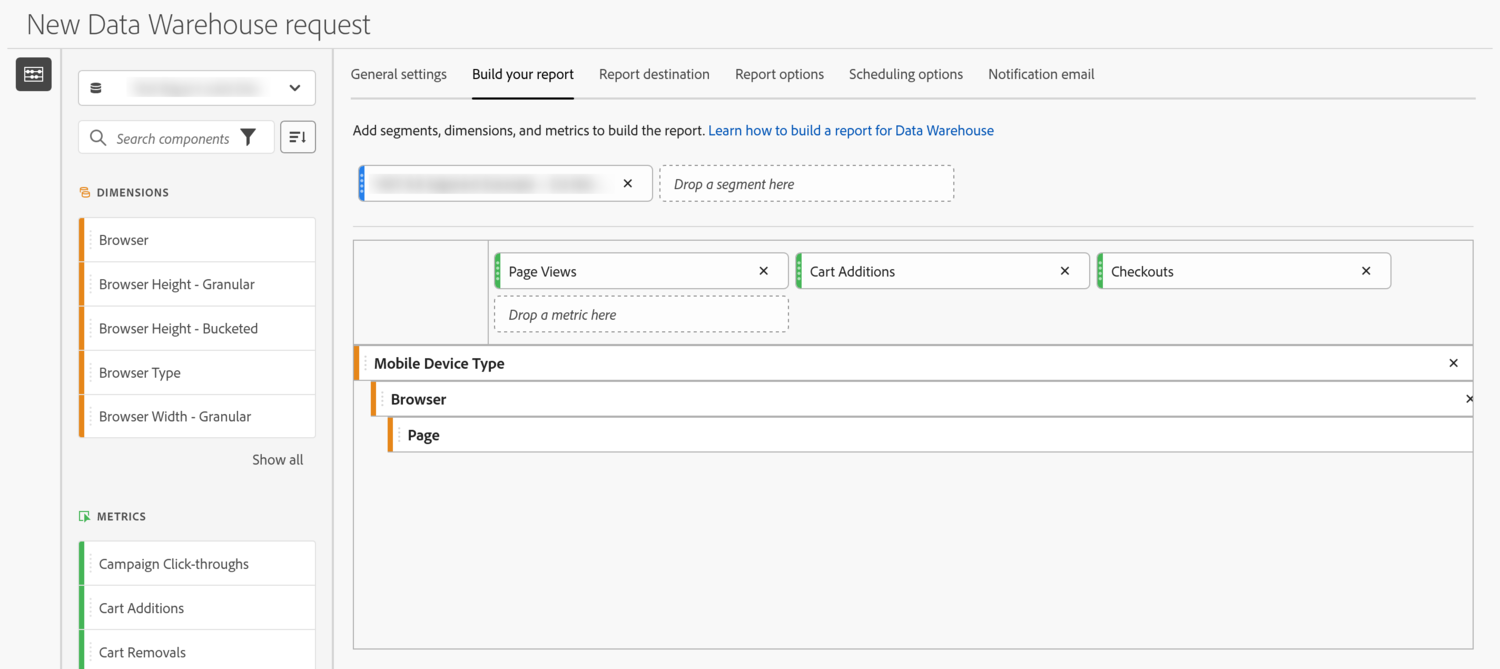
| Build your report | Metrics, dimensions, breakdowns and segments. The table itself. | Every extra dimension multiplies rows. This is where files get out of hand. |
| Report destination | Where the finished file is sent | Covered in Delivery Options. |
| Report options | File name, format, compression, manifest, row count | Covered in Delivery Options. |
| Scheduling options | One-off, or a repeating schedule | Only scheduled requests can be edited later. This one has real consequences. |
| Notification email | Who hears that it succeeded or failed | Put a shared inbox here, not one person. |
The scheduling point deserves flagging early because it is not obvious and it cannot be undone. A request you set up as a one-off cannot be edited afterwards. If you got a dimension wrong, you build a new request from scratch. A scheduled request can be opened and changed, so people who work with Data Warehouse regularly tend to schedule almost everything, even things they expect to run once.
Dimensions multiply, metrics do not
This is the arithmetic that decides whether your file is useful or unusable, and it is easy to get wrong because nothing warns you.
Adding a metric adds a column. Ten metrics is ten columns and the file is barely any longer.
Adding a dimension adds rows, and it does not add them, it multiplies them. One dimension with 400,000 values gives you 400,000 rows. Break it down by product category with 200 values and you are asking for every combination that actually occurred, which can easily be several million rows. Add day granularity across a quarter and you have multiplied again by ninety.
So the rule of thumb is to be generous with metrics and mean with dimensions. Metrics are cheap. Every dimension you add should be one you will actually group by or filter on when the file lands somewhere else.
Build the request exactly as you want it, but set the date range to a single day, and send it to email. It usually comes back quickly and it tells you three things you cannot learn any other way: whether the columns are the ones you expected, whether the row count is in the range you assumed, and whether the values look sane. Multiply that row count by the number of days you actually want and you know the size of the real file before you commit three days to producing it. This one habit prevents most of the wasted requests in this module.
Granularity is a dimension wearing a different name
The date granularity setting looks like a formatting choice and behaves like a dimension.
Set it to none and you get one set of totals for the whole period. Set it to daily and every row is repeated for every day in the range, so a request covering ninety days becomes ninety times larger. Weekly and monthly sit in between.
One thing about the date range itself surprises people who live in Analysis Workspace. Data Warehouse does not accept the date range components you have built there. It offers its own list of presets, things like Yesterday, Last 7 days, This month and Last month, plus a custom range you enter yourself. The carefully named ranges your team uses in every Workspace project are simply not on the menu here, so the period has to be described again in this form's own terms.
Pick it from what the receiving system needs, not from a feeling that more detail is safer. If the file feeds a dashboard that shows monthly totals, daily granularity is ninety times the rows for no benefit. If somebody downstream needs to build their own trend, you need the daily rows and there is no way around it.
Segments work, with conditions
You can apply segments to a request, and this is usually the right way to narrow it. A segment for purchasers is better than exporting everybody and filtering later.
The condition is that segments have to be compatible with Data Warehouse, and not all of them are. A definition that runs perfectly in Workspace can be refused here, usually because it mixes container scopes in a way this engine cannot process, or uses a sequential construction, or contains a component Data Warehouse does not support. The rule underneath is simple: anything unsupported in a request is also unsupported in a segment applied to that request.
Segment compatibility is flagged in the segment builder itself, and the mechanics are covered in Segment Types and Sharing. The practical habit is to check compatibility when you build the segment rather than discovering it here.
Data Warehouse does not accept calculated metrics at all. Not some of them, none of them. Teams whose entire reporting vocabulary is built on calculated metrics discover this at the point of building the export, after the export has been promised. There are two ways out and both need deciding early. Either export the underlying metrics and rebuild the calculation in whatever system receives the file, which is usually correct and means the definition now lives in two places, or accept that this particular number cannot come from Data Warehouse. Whichever you choose, write down where the definition now lives, because a formula that exists in two systems will drift.
Follow along: build a request that fits
This builds a real request end to end, sized so that it comes back quickly. Stop before the destination tab, which Delivery Options covers properly.
- Part one, decide before you click
- Write down, in one sentence, what a single row of your finished file will represent. For this exercise: one row is one search term, for one product category, for one day.
- Part two, build it
-
Go to
Tools›Data Warehouseand chooseAdd. -
On
General settings, name it so the contents are obvious, pick your report suite, and set the date range to one day. Something likesearch-term-by-category-daily. Avoid names liketestandDW request 3. -
On
Build your report, addOrdersandRevenueas metrics. Metrics are columns. Two or ten makes little difference to the file size. -
Add
Internal Search Termas your dimension, then addProduct Categoryas a breakdown underneath it. This is the step that decides the row count. Two dimensions, not six. - Apply a segment if you have a compatible one. A purchasers segment is a good test. If the segment is greyed out or refused, that is the compatibility rule, not a fault.
-
Set granularity to
Daily, then set the destination to email and submit. Email is fine for a one day test file. Anything larger belongs in cloud storage. - Part three, read what comes back
- When the file arrives, check the columns against your sentence from part one, and count the rows. Multiply that row count by the number of days you really want. That is the size of the real request.
There is nothing else to configure on the reporting side. A date range, some metrics, one or two dimensions, and a segment. Everything after this is about where the file goes and how often, which Delivery Options covers.
Say what one row is, then build
A Data Warehouse request is a table described in advance to a system that will not ask you anything and will not let you adjust once it starts. The work belongs at the front, and the test is whether you can say in one sentence what a single row of the result represents.
Metrics are columns and cost you almost nothing. Dimensions are rows and multiply, and granularity is another dimension in disguise. Segments are the right way to narrow a request, as long as the definition is compatible. Calculated metrics are refused outright, which is the constraint most likely to force a redesign, so check for it before anything is promised.
Schedule requests even when you expect them to run once, because a one-off cannot be edited afterwards and a scheduled one can.
What is left is the half of the form this section skipped. A finished table has to arrive somewhere a person or a system can actually use, in a format they can read, often on a repeating cycle nobody has to remember. Delivery Options covers destinations, file formats, scheduling, and the small settings that decide whether an automated pipeline works or breaks quietly.
Analytics > Tools > Data Warehouse > Add. The form opens on General settings and the tabs run in order through Build your report, Report destination, Report options, Scheduling options and Notification email.
Existing requests are listed on the same Data Warehouse page with their status. Only requests configured to run on a schedule can be opened and edited; a completed one-off request can be copied but not changed.
This article focuses on the concepts, architecture, and practical guidance behind the topic. For the latest UI walkthroughs and step-by-step implementation instructions, use the links below. They leave this site and open Adobe's own documentation in a new tab.