Analyze the data › Analysis Workspace
Projects and Panels
Somebody asks which channel brought the most traffic last month. Search, comfortably. That took one report and about forty seconds.
Nobody has ever stopped there. The next question is what Search converts at. Then how that conversion rate is defined, because two people in the room are using the number differently. Then what those visitors actually did after they arrived, and where most of them gave up.
That is four follow-up questions, and it would be a mistake to treat them as four separate pieces of work, because each one only exists because of the answer to the one before it. They are a single conversation that happens to need five different reports, and the person asking them has no interest whatsoever in which report each answer comes from.
One question is never one question
That chain is worth looking at closely, because it is the entire argument for how this screen is built.
Data is connected because behavior is connected, so a genuine analytical question almost never resolves into a single number. It resolves into a thread. The reporting interface that Analysis Workspace replaced could answer every one of those five questions perfectly well, and could only answer them one at a time, each in its own view, each saved before the next could begin. Assembling them into something a person could read meant building a Dashboard afterward out of reports you had already finished.
So fifteen minutes of genuine thinking cost most of a day of clicking, and the thinking had to stop every time the tool needed something saved. That gap between how fast a question moves and how slowly the software could follow is what panels exist to close.
A project is the whole conversation, not one answer
Start with what you are actually making, because the vocabulary matters here and Adobe chose its word carefully.
Ask somebody what they build in Workspace and the answer wobbles. A report? A dashboard? A set of tables with some charts? It is all of those and none of them, because it may hold twelve tables, four charts, a fallout, notes to a colleague, and data drawn from three different report suites that have nothing to do with each other.
"Report" is too small for that. "Dashboard" implies a fixed set of tiles somebody reads rather than works in. So Adobe called it a project, and the word is doing real work: a project is a body of connected analysis with a purpose, not a single output.
The consequence that catches people out is ownership. A project does not belong to a report suite. It belongs to the login company, and to the person who created it. That is why one project can compare two brands, two regions, or last year's suite against this year's replacement, and it is why you will not find your projects by going looking inside a report suite's settings.
The panel is where a question gets its context
Underneath the project sits the piece that does the actual work. Panels look like visual grouping, a way of putting related things near each other on a long canvas, and that reading is natural enough that most people hold it for months without running into trouble. What a panel really is, though, is a scope boundary, and once you see it that way most of its behavior stops being surprising.
Every panel owns three things, and everything placed inside it inherits all three without being asked.
That inheritance is the whole point of the container. You set the context once, at the top, and then stop thinking about it while you build. Drag in a table, a chart, a fallout, and none of them ask which suite or which dates, because the panel already answered.
It also means a panel is cheap to reason about and cheap to copy. Duplicate a panel and you duplicate its context along with its contents, which is why the fastest way to compare two periods is rarely to build a second report. It is to duplicate the panel and change one date.
Any comparison that holds the analysis constant and varies one dimension of context is a duplicate rather than a rebuild. Same tables, last quarter instead of this one. Same tables, the German suite instead of the global one. Same tables, first-time visitors instead of everyone. Right-click the panel header and duplicate it, change the single setting, and the two sit side by side answering the same question about different worlds. Rebuilding by hand is how the second version quietly ends up not matching the first.

The calendar holds more than a start and an end
The date range gets set once, early, and then stops being thought about, which is a shame because two things inside it change answers.
The first is the comparison. Turning it on adds a second period and a set of percent-change columns, and the two presets are previous period and previous year. Previous period is the obvious choice and frequently the worse one, because periods do not contain equal amounts of week. Compare this month against last month and you may well be comparing four weekends against five, which moves almost every metric a consumer site has without anything having happened. Previous year lines the weekdays up far more closely, and for anything with a weekly rhythm it is the more honest comparison even though it feels like the more distant one.
The second is quieter. The calendar runs on the report suite's time zone, not yours. A suite configured in another region has a different idea of when a day starts, so the "today" in your panel may not be your today, and a daily number can look wrong to two people in different offices who are both reading it correctly. The setting itself belongs to the suite and is covered in Report Suite Settings. What matters here is knowing that the panel inherits it, and checking it before arguing about a figure that only disagrees by a day.
Where you drop a segment decides what it touches
The same flexibility that makes panels useful creates the one mistake worth naming in this section, and it produces no error at all.
A segment can be dropped in several places, and each one scopes it differently. They look almost identical afterward.
| Dropped on | What it filters | Use it when |
|---|---|---|
| The panel drop zone | Every table and every visualization in that panel | The whole question is about that audience |
| A table column | That column only, sitting beside unfiltered columns | You are comparing the segment against everyone |
| A single cell | That one intersection | Rarely, and usually by accident |
| Another panel | Nothing in this panel at all | Never, but it happens constantly |
Drop a segment on the panel and every number in it moves. Drop the same segment one panel lower, and the panel you were looking at goes on reporting unfiltered totals that look entirely reasonable. There is no error, no highlight, and no warning, because both states are legitimate. Two people reading the same project will then quote different figures for what they both believe is the same question. Before trusting any number in a project you did not build, read the panel header and the drop zone together: which suite, which dates, which segments. Those three lines decide what every figure beneath them means.
Adobe pre-shaped some of the questions
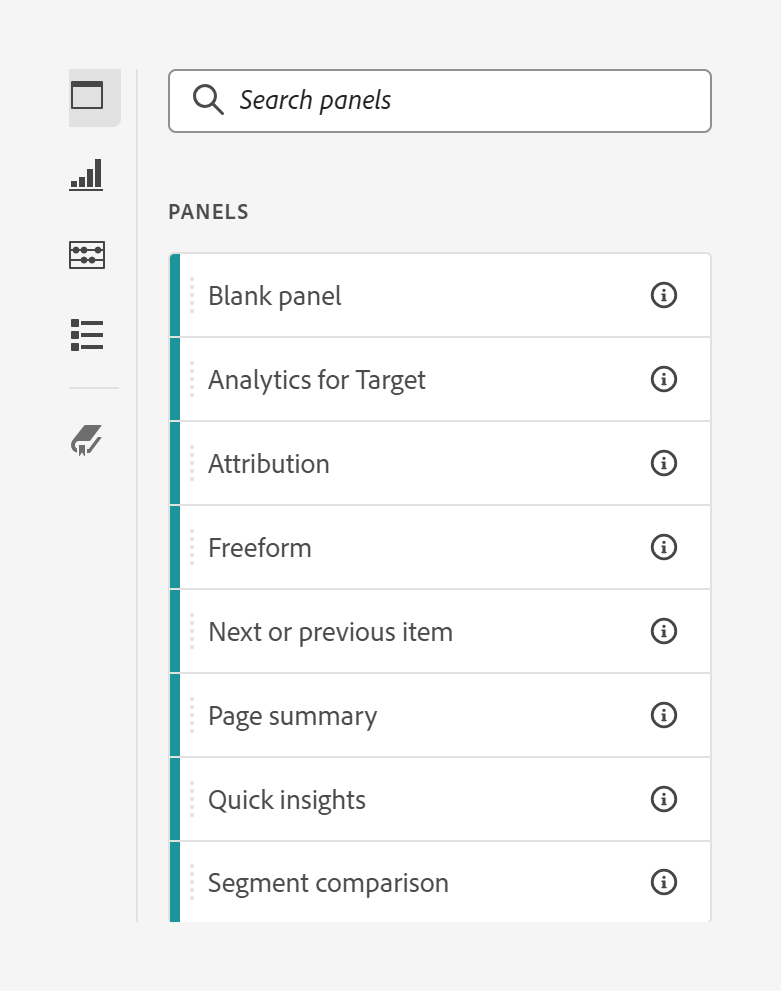
A blank panel is the default and most work starts there. But the panel picker offers a set of pre-built panels, and they are not templates in the decorative sense. Each one is a question somebody asks often enough that Adobe built the arrangement for it.
| Panel | The question it answers |
|---|---|
| Blank | Anything. You choose the visualization yourself. |
| Freeform | The general-purpose table, and the one you will use most. |
| Attribution | Which model credits this dimension, and how differently. |
| Segment comparison | What is actually different between these two audiences, across everything. |
| Next or previous item | What did people see immediately before or after this. |
| Page summary | Everything worth knowing about one page, assembled. |
| Quick insights | A guided path for somebody who does not yet know what to drag. |
| Analytics for Target | How did the Target activity actually perform, read in Analytics. |
The picker is not identical across companies. Three media panels, Average Minute Audience, Concurrent Viewers and Playback Time Spent, appear only where Streaming Media Collection is provisioned, and Analytics for Target needs the integration in place. A panel missing from your list is usually an entitlement question rather than a version difference, which matters when following a guide written against somebody else's account.
Segment comparison is the one most people never open and should. It takes two segments and works through every dimension and metric available, then reports where they genuinely diverge rather than where you thought to look. It answers a question you did not know how to ask, which is a rare thing in reporting software.
One entry in that list is doing something the others are not, and it is worth flagging here even though it belongs elsewhere. The Attribution panel accepts any dimension, not only marketing channels, and it recalculates its models at the moment a report runs rather than depending on decisions made when the data was collected. That is why it can re-answer history, and why a variable's own persistence stops constraining it. It is the first place this product separated what was collected from how it is interpreted, which is the idea Customer Journey Analytics was later built on.
Attribution is a large enough subject to have a module of its own, and this panel dominates it. What Is Attribution is where the models get taken apart.
A project is an object, and deliberately not a file
Save a project and it stops being a screen and becomes a thing with an identity. It has a name, an owner, a location in a folder structure, and a set of behaviors that belong to it: it can be shared with named people, scheduled to send itself on a timetable, exported, copied, and curated so that a recipient sees a deliberately reduced set of components. Sharing and Collaboration covers what that opens up, and Curation and Templates covers the reduction.
In every respect it behaves like a document in an office suite, with one deliberate difference: there is no file. Nothing is written to a disk, nothing is emailed as an attachment, and nothing exists in one place that can be lost with a laptop.
That is the same decision that moved this product into the browser in the first place. A project lives in the platform, so credentials and a connection are the entire prerequisite for reaching it, from any machine, including one you have never used before. The cost is that there is no offline copy and no local backup, which is a real trade and not a small one. The benefit is that the work is never stranded on a device.
Until it is saved, though, none of that applies. An unsaved project carries a quiet "unsaved changes" note near its name and exists only in the browser tab you are looking at.
Follow along: build the container before the content
This is the habit worth forming, and it takes two minutes. Set the context first, then build inside it, rather than building something and trying to work out afterward what it was measuring.
- Part one, set the context
- Open
Analytics›Workspace›Create new project›Blank project. - In the panel header, top right, choose the report suite, then the dates. Both before you drag anything in. Everything you build next will silently inherit them.
-
Drag any segment onto
Drop a component to filter. That is the panel drop zone. The chip that appears now applies to everything in this panel. - Part two, watch it inherit
- Build a freeform table with any dimension and any metric.
- Add a second visualization to the same panel. Neither one asked you for a report suite or a date range. They took the panel's.
- Change the panel date range. Both update together. That is the container doing its job.
- Part three, prove the boundary
- Choose
Insert›New blank panel. - Give the second panel a different date range, then scroll between them. Nothing in the body of either panel tells you they disagree. Only the headers do.
- Remove the segment from panel one and watch every number move, then put it back. That is the difference between a panel segment and a column segment, seen once rather than read.
-
Choose
Project›Save as, and give it a name you would recognize in six months. Until this step, it exists only in this tab.
There is nothing else to configure. A panel has no settings beyond the three in its header, and that is the entire design.
None of that is the limit of what a panel can do, only the least worth knowing about one. Step 8 in particular is worth doing deliberately once, because it is the failure you will otherwise meet for the first time in front of somebody who is asking why two numbers disagree.
What you have now
A project is a body of connected analysis that belongs to your company rather than to any report suite, and it exists as an object in the platform rather than a file on a machine. Inside it, panels are scope boundaries: each one owns a report suite, a date range and any segments dropped on it, and every table and chart placed inside inherits all three without being asked.
The reason that structure exists is the conversation at the top of this section. Real questions arrive in threads, each one produced by the answer before it, and a tool that can only hold one answer at a time forces you to abandon the thread in order to record it. Panels let the thread stay on screen while it is still being followed.
What is still missing is the thing inside the container. Every panel so far has been an empty context waiting for content, and almost all of that content, in almost every project ever built, is one component. Freeform Tables takes it apart: how rows and columns decide what is being counted, what a breakdown really does to a number, and why the same two components can produce several different correct answers depending on how the table is arranged.
Analytics > Workspace lists every project you own or that has been shared with you. Create new project offers a blank project or a template.
Inside a project, the Panels icon is the first in the left rail and holds the panel picker. Insert > New blank panel adds one directly. Right-click any panel header to duplicate, rename, collapse or delete it.
This article focuses on the concepts, architecture, and practical guidance behind the topic. For the latest UI walkthroughs and step-by-step implementation instructions, use the links below. They leave this site and open Adobe's own documentation in a new tab.