Analyze the data › Attribution Models
What Is Attribution
Three teams present numbers for the same quarter. The email team says email drove 4,000 orders. Paid search says it drove 3,500. Display says 900. Add those up and you get 8,400. Then the finance director says the company took 5,000 orders in total.
Nobody has made a mistake. All four numbers came out of the same data and all four are correct.
The problem is that three of those numbers are not measurements. They are opinions about who caused the orders, and each team used a different opinion without saying so. Until somebody explains that, the meeting cannot move forward.
There is no field in the data for why
Adobe Analytics records what people did. Each hit carries the page name, the browser, the campaign code if you captured one, the marketing channel if your rules set one, and on the hit that matters, the purchase and its value.
Look at every hit a visitor ever sent and you can see everything they did and when they did it. What you cannot see is why they bought. There is no field for it. No analytics tool has one, because the reason sits inside the person and a tag on a web page cannot read it.
So Adobe does not guess. It gives you a set of rules for splitting the credit for a sale among the things that happened before it, and it asks you to pick one of those rules. The rule you pick is the attribution model.
That is worth saying plainly. Attribution does not measure influence. It shares out credit using a rule you chose.
A restaurant that pools its tips has the same problem. The total tips for the evening are a fact and anyone can count them. How you split that total between the waiter, the chef, the person on the door and the one carrying plates is not a fact. It is a rule the restaurant agrees in advance. No split is the true one. Some are fair, some are clearly unfair, and the restaurants that never agreed a rule are the ones where staff argue every night.
Attribution works the same way. The sale is the fact. The split is the rule.
A touch point is just a value on a hit
Before the models make sense, you need to know what they actually work on. Most people assume something cleverer is going on than really is.
Attribution works on one dimension at a time. You pick the dimension and you pick the success metric. Then for each sale, Adobe looks back through that visitor's hits, finds every hit where your dimension had a value, and splits the sale among those values using your model.
That is the whole thing. Each value it finds is called a touch point. There is no judgement of how persuasive an advert was, and nothing statistical unless you choose the algorithmic model.
Two things follow from this, and both are more useful than any comparison of models.
The first is that attribution can only share credit between values you actually collected. Say a visitor sees a billboard, talks to a colleague about it, and searches for your brand a week later. Nothing about the billboard arrives with them. There is no touch point for it, so it gets no credit, and no setting anywhere in Adobe will change that. Attribution depends on your implementation. That is why a module about reporting keeps pointing back at collection.
The second is more useful day to day. A touch point is only a dimension value, so attribution is not limited to marketing. Internal search terms, on-site promotions, product categories, page names and login state are all dimensions, and you can run a model against any of them. You can ask which internal search terms lead to purchases, counting every search a buyer ran rather than only the last one. It takes the same two clicks as a channel report, and hardly anyone tries it.
Almost every example of attribution you will ever see uses Marketing Channel, so most people file the whole thing under marketing reporting. That is worth unlearning early. The two grew up together and they are used together constantly, but nothing actually ties them. A model needs a dimension and a success event, and it does not care what the dimension is about. Some of the most useful attribution work in a business has nothing to do with media spend: which internal search terms buyers used before they bought, which product category they browsed first, which on-site promotion they saw three visits ago. Nobody is competing for that credit, which is probably why nobody has ever asked for the report.
Adobe seems to have reached the same conclusion. In Customer Journey Analytics the two swap places. Attribution becomes a setting held on the metric itself, and marketing channels become one defined field among many rather than a subsystem with its own admin screens. How that works is a subject for another product and another day. It is worth knowing here because it tells you which of the two ideas is the bigger one.
Attribution does not work on page views or visits
This is where most people hit their first wall, and the interface gives them nothing to work with.
Open the column settings on a Page Views column and the attribution option is simply not there. The same goes for Visits, Unique Visitors, Occurrences, Entries, Exits, Bounces, Bounce Rate, Time Spent, Searches, Single Page Visits and Single Access. The feature you have just been reading about looks like it is missing or switched off.
It is not missing. It does not apply, and the reason is worth sitting with, because it says what attribution actually is.
Attribution shares out credit for something that was achieved. A purchase, a lead, a subscription, a download. Somebody wanted it to happen, and several things may have helped cause it. A page view is not an achievement. Nobody competed to cause it. The visitor either arrived carrying a marketing channel or they did not, and there is no credit sitting there waiting to be divided.
So when a stakeholder asks for first touch attribution on visits, the honest answer is that the question has no meaning, not that the tool cannot do it. That is a more useful answer, and it usually leads to working out what they actually wanted to know.
You cannot apply a model to a finished calculated metric either. The setting is not offered on it. Instead you set attribution on the individual metrics inside the definition, while you are building it. So a calculated metric can be attributed, but only from the inside, and only by whoever opens the builder. If you inherit one and want it on a different model, you have to go into the definition and change it, or copy it and build a second version. It also means the model is buried where nobody reading the column will ever see it, which is the strongest argument there is for putting the model in the metric's name.
Adobe ignores your eVar settings when it attributes
This part surprises people who have been configuring report suites for years, and it changes where you should spend your design time.
Normally, persistence is a property of the variable. You give an eVar an expiration and an allocation setting, and Adobe carries its value forward from hit to hit as the data is processed. A prop gets none of that. It describes the hit it was set on and is gone by the next one. Both behaviours are fixed at collection time. Those settings are covered in eVars (Conversion Variables).
Attribution does not use any of that. When a model runs, Adobe goes back to the hits, reads the values that were actually set on them, and does its own carrying forward across the lookback window you chose. Your eVar's allocation setting is ignored. Your eVar's expiration setting is ignored. The window you set in the report replaces both of them, and you can set a different window in the next report.
Attribution rebuilds persistence from the raw hits, so it does not care whether the dimension was designed to persist. Take a prop set once on a landing page, one that has been useless for conversion reporting since the day it went live. Give it first touch attribution with a 90 day window and it behaves as though it had always been an eVar. If your implementation has a prop somebody has always wished was an eVar, this is worth trying. The fix is a report setting, not a change to your tags.
There is a limit to this, and it catches people out.
Attribution models only exist in Analysis Workspace. Classic reports, the reporting API, data feeds and warehouse extracts all read the processed data, where your eVar's expiration and allocation work exactly as they always did. So an eVar set to expire on the visit can be attributed across 90 days inside Workspace and is still visit-scoped everywhere else. Two teams reading the same variable through different tools will get different numbers, and neither of them has done anything wrong.
Why these numbers never match the order system
Now the meeting at the top of this page can be answered properly.
The 5,000 orders in the finance system are real sales. The 4,000 email orders are not 4,000 sales. They are email's share of those same 5,000 sales, worked out using whichever model that team had selected.
Under last touch, each sale is given whole to one channel, so the channel numbers add up to 5,000 and everything reconciles. That is why last touch is the default and why many companies never notice the problem. Under participation, every channel involved gets 100% of the sale, so the numbers are meant to add up to far more than 5,000. A room that adds them up has misread the model, not found an error.
Two smaller effects widen the gap. If a hit carries several values for the same dimension, which is what a list variable does, each value gets the same credit while the report total counts the sale once. And every report has a None row holding sales that had no touch point at all inside the window. None is a real answer and it is covered in Lookback Windows.
So build one habit early. An attributed number is not a count of something that happened. It is a share, worked out under a rule you picked. Asking it to agree with the order system is like asking the tip split to agree with the bill.
Always say which model and which window
Because the model is a choice and the window is a choice, a number quoted without both of them cannot be checked by anyone.
"4,000 email orders" is not something a colleague can agree or disagree with. "4,000 email orders, last touch, 30 day visitor window" is. They can reproduce it, argue with the choice, and compare it to next quarter. It is also easier to defend, because the argument becomes about the rule rather than about whether your team can count.
In practice this means putting the model and the window in the metric's name or the panel description, not just in your head. A metric called Orders will confuse whoever opens the project in six months. A metric called Orders, first touch, 30 day will not.
Follow along: turn one column into two
Ten minutes in a real report suite makes this concrete. Any report suite with a conversion metric and a channel or campaign dimension will do.
-
Build a freeform table with
Marketing Channelin the rows andOrdersin the column. Set the date range to a full quarter. This is the default report, and the default is last touch. Note the top three channels. -
Right click the
Orderscolumn header and chooseDuplicate column. -
Open
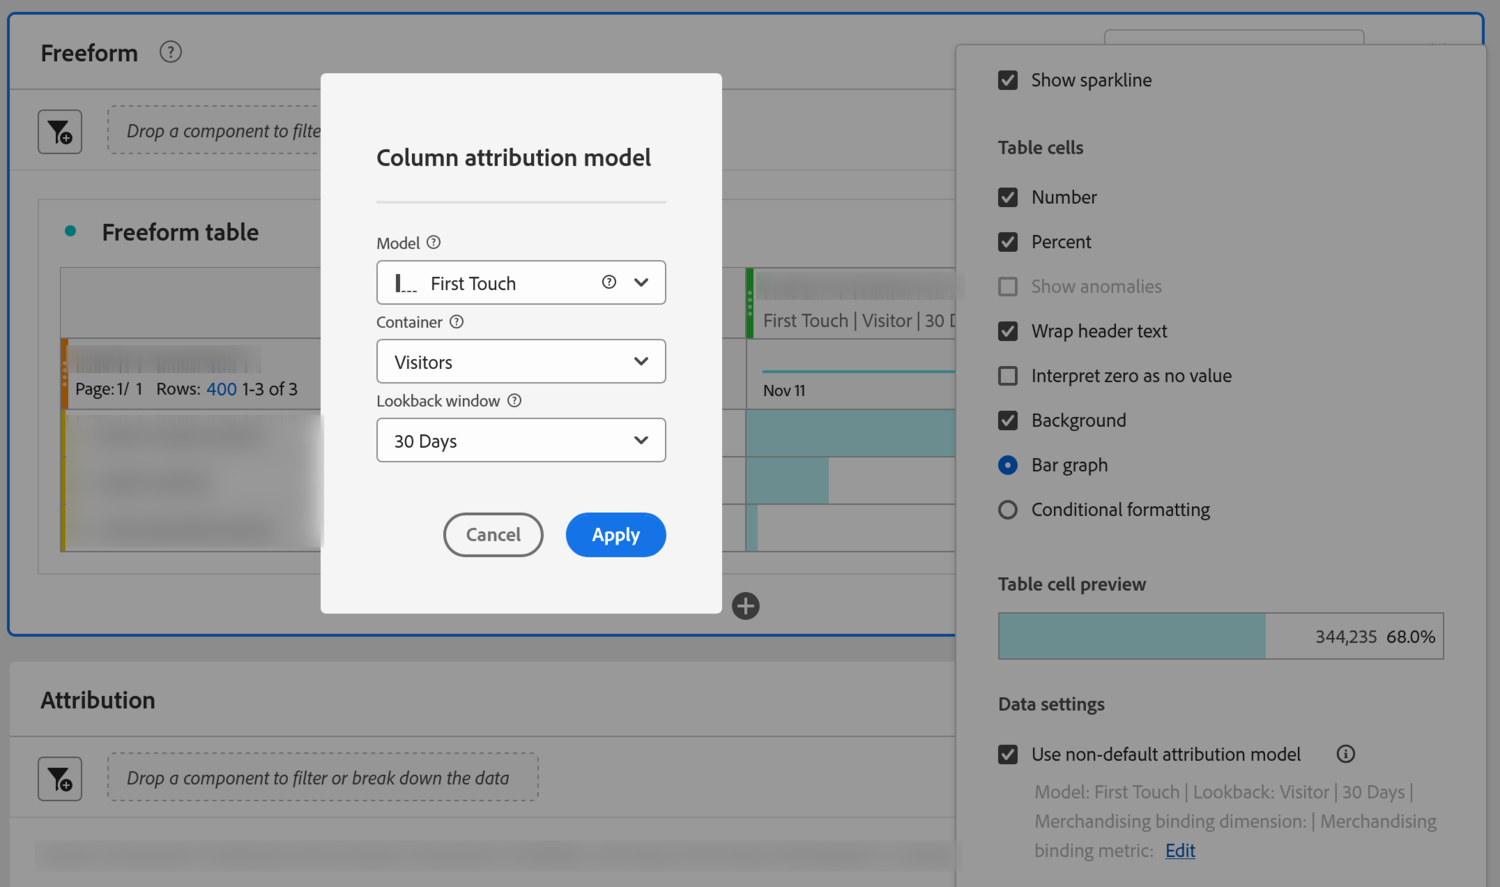
Column settingson the second column, tickUse non-default attribution model, and chooseFirst Touch. Two more settings appear below the model. You will use them in the next step. -
Set the container to
Visitorand the lookback window to90 days. Apply. Visitor lets the model look across several visits. Without it, a journey that spans weeks is invisible. -
Rename both columns so each one carries its model. Double click the header to rename.
Orders, last touchandOrders, first touch, 90 day. Takes two seconds and saves the next person a lot of guessing. - Compare the two columns instead of reading either one on its own. Channels that get bigger from left to right are finding new customers. Channels that shrink are closing them. Direct usually shrinks a lot.
-
Swap the dimension for
Internal Search TermorProduct Categoryand leave the columns alone. It still works, because a touch point is only a dimension value. Most people never try this.
There is nothing else to set up. A model, a container and a window on one column gives you the whole comparison. The rest of this module is about choosing those three well, not about a different mechanism.
Credit is shared, not measured
Attribution exists because the data records what happened but never records why. Credit for a sale has to be shared out using a rule, not discovered by measurement. The rule works on one dimension at a time, treats every value found on a hit inside the lookback window as a touch point, and splits the sale between those touch points.
Two things about that are worth carrying out of here, because both go against what people assume. It works on any dimension, not just marketing channels. And it only works on success events, which is why the setting is missing when you try it on page views or visits.
Adobe rebuilds persistence from the raw hits when a model runs. That is why your eVar settings are ignored inside Workspace, why you can attribute a prop, and why these numbers are shares rather than counts.
The habit that matters most is the tip pool one. When two people disagree about an attributed number, they are usually not disagreeing about the data. They are disagreeing about the rule, and that is a decision the business is allowed to make and has probably never been asked to make.
Next come the rules themselves. Adobe gives you eleven, they split credit in quite different ways, and two of them will quietly override your choice on more rows than you would expect. Attribution Models Compared covers all of them, including the one that is not really a split at all.
Attribution is set in Analysis Workspace, not in Admin. In a freeform table, right click a metric column header, choose Column settings, then tick Use non-default attribution model to reveal the model, container and lookback settings.
The same three settings appear in the calculated metric builder, on any metric in the definition, and in the Attribution panel, which compares several models at once. Adobe called this feature Attribution IQ when it launched, and that name still appears in older tutorials.
This article focuses on the concepts, architecture, and practical guidance behind the topic. For the latest UI walkthroughs and step-by-step implementation instructions, use the links below. They leave this site and open Adobe's own documentation in a new tab.